US-WI2


Location

lon / lat [deg]: -91.1528 / 46.6869

Source network: FLUXNET


Geostationary surface albedo (GSA) data


“+000”


“+057/+063”


Landcover information (based on ESA CCI landcover data)


Landcover fractions @ 2km distance


Landcover fractions @ 20 km distance


Legend


Distance to open water bodies [km]:

2.1

Distance to urban areas [km]:

1.38


Radius: 1 km

Number of landcover classes:

5

Dominant landcover type:

60: Tree cover, broadleaved, decidous

Fraction of dominant landcover type [%]:

46.0


Radius: 2 km

Number of landcover classes:

6

Dominant landcover type:

60: Tree cover, broadleaved, decidous

Fraction of dominant landcover type [%]:

43.0


Radius: 5 km

Number of landcover classes:

7

Dominant landcover type:

60: Tree cover, broadleaved, decidous

Fraction of dominant landcover type [%]:

38.0


Radius: 10 km

Number of landcover classes:

7

Dominant landcover type:

60: Tree cover, broadleaved, decidous

Fraction of dominant landcover type [%]:

38.0


Radius: 20 km

Number of landcover classes:

7

Dominant landcover type:

60: Tree cover, broadleaved, decidous

Fraction of dominant landcover type [%]:

40.0


Disturbances


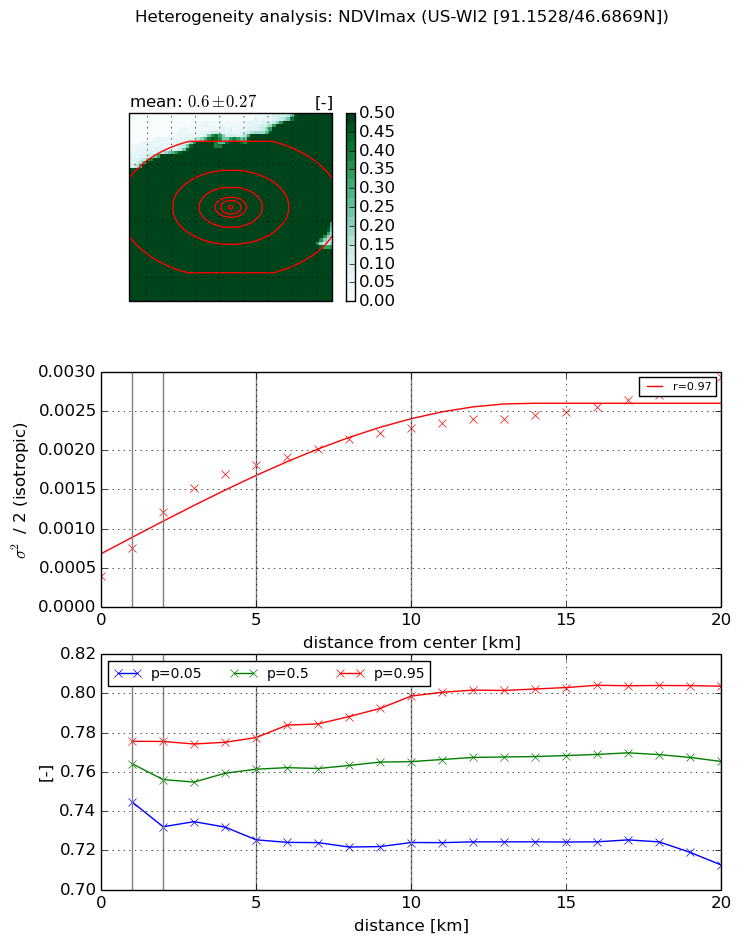
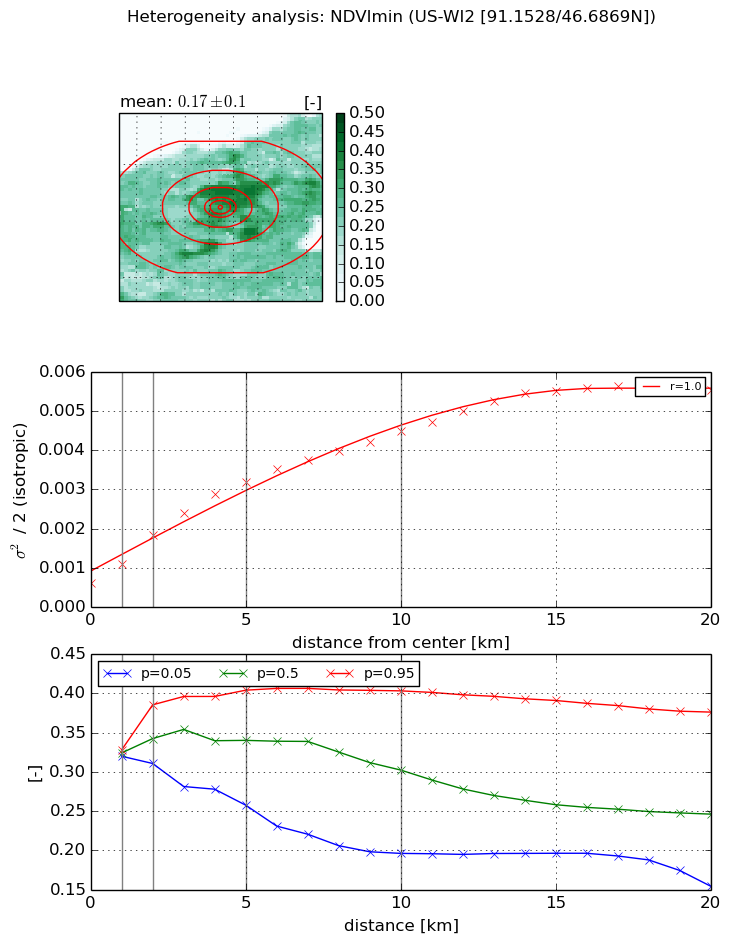
Heterogeneity analysis

The heterogeneity analysis provides information about the spatial and temporal heterogeneity of the site.

Topography


Roman et al. (2009) index


St

0.996055606588

Rcv

0.360217686109

Rse

0.0

Rst

-0.116618413406

Rsv

2.53504394027


Height range @ 1km [m]

48

Height range @ 2km [m]

43

Height range @ 5km [m]

58

Height range @ 10km [m]

-999

Height range @ 20km [m]

-999


Variance slope @ 1 km

125

Variance slope @ 2 km

101

Variance slope @ 5 km

70

Variance slope @ 10 km

-999

Variance slope @ 20 km

-999


NDVI (max. NDVI composite)


Roman et al. (2009) index


St

1.45312232231

Rcv

0.393411054402

Rse

0.0

Rst

-0.67110929222

Rsv

-0.999999586724


NDVI range @ 1km [-]

0.03

NDVI range @ 2km [-]

0.04

NDVI range @ 5km [-]

0.05

NDVI range @ 10km [-]

0.07

NDVI range @ 20km [-]

0.09


Variance slope @ 1 km

0.000352622301794

Variance slope @ 2 km

0.000408698191805

Variance slope @ 5 km

0.000291238992335

Variance slope @ 10 km

0.000175465085298

Variance slope @ 20 km

9.8892143122e-05


NDVI (min. NDVI composite)I


Roman et al. (2009) index


St

1.72427032348

Rcv

0.429332636857

Rse

0.0

Rst

-0.310534736236

Rsv

-0.999999026709


NDVI range @ 1km [-]

0.01

NDVI range @ 2km [-]

0.07

NDVI range @ 5km [-]

0.15

NDVI range @ 10km [-]

0.21

NDVI range @ 20km [-]

0.22


NDVI slope @ 1 km

0.000496286496918

NDVI slope @ 2 km

0.000617653681714

NDVI slope @ 5 km

0.000536961275111

NDVI slope @ 10 km

0.000378074591254

NDVI slope @ 20 km

0.000241335721961


Temporal stability analysis

+000 deg (BHR)


BHR statistics

Temporal stability [1/decade]:


abs

rel


Weighted least square:

None


Ordinary least square:

None


Probabilities that GCOS criteria is met:

Weighted least square:

None %

Ordinary least square:

None %


DHR statistics

Temporal stability [1/decade]:


abs

rel


Weighted least square:

None


Ordinary least square:

None


Probabilities that GCOS criteria is met:

Weighted least square:

None %

Ordinary least square:

None %


+057/+063 deg (BHR)


BHR statistics

Temporal stability [1/decade]:


abs

rel


Weighted least square:

None


Ordinary least square:

None


Probabilities that GCOS criteria is met:

Weighted least square:

None %

Ordinary least square:

None %


DHR statistics

Temporal stability [1/decade]:


abs

rel


Weighted least square:

None


Ordinary least square:

None


Probabilities that GCOS criteria is met:

Weighted least square:

None %

Ordinary least square:

None %


Temporal anomaly analyis

The variance of the temporal anomalies provides an additional measure about the stability of the signal AFTER removal of the mean seasonal cylce.

+000 deg


+057/+063 deg