US-WI5


Location

lon / lat [deg]: -91.0858 / 46.6531

Source network: FLUXNET


Geostationary surface albedo (GSA) data


“+000”


“+057/+063”


Landcover information (based on ESA CCI landcover data)


Landcover fractions @ 2km distance


Landcover fractions @ 20 km distance


Legend


Distance to open water bodies [km]:

2.25

Distance to urban areas [km]:

4.04


Radius: 1 km

Number of landcover classes:

5

Dominant landcover type:

60: Tree cover, broadleaved, decidous

Fraction of dominant landcover type [%]:

50.0


Radius: 2 km

Number of landcover classes:

5

Dominant landcover type:

60: Tree cover, broadleaved, decidous

Fraction of dominant landcover type [%]:

36.0


Radius: 5 km

Number of landcover classes:

6

Dominant landcover type:

60: Tree cover, broadleaved, decidous

Fraction of dominant landcover type [%]:

50.0


Radius: 10 km

Number of landcover classes:

7

Dominant landcover type:

60: Tree cover, broadleaved, decidous

Fraction of dominant landcover type [%]:

36.0


Radius: 20 km

Number of landcover classes:

7

Dominant landcover type:

60: Tree cover, broadleaved, decidous

Fraction of dominant landcover type [%]:

35.0


Disturbances


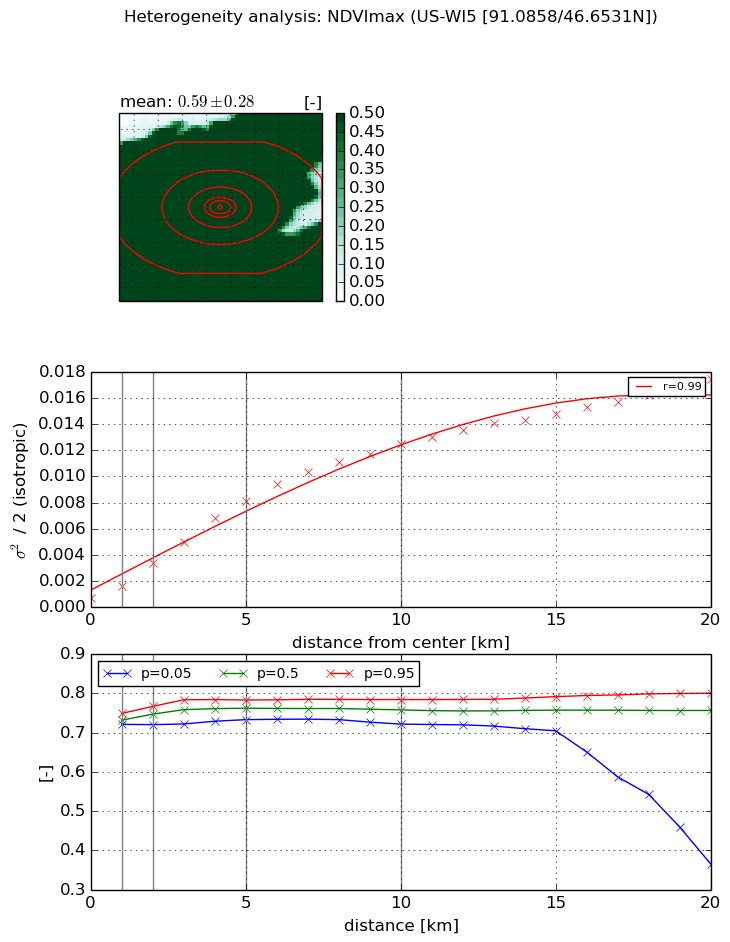
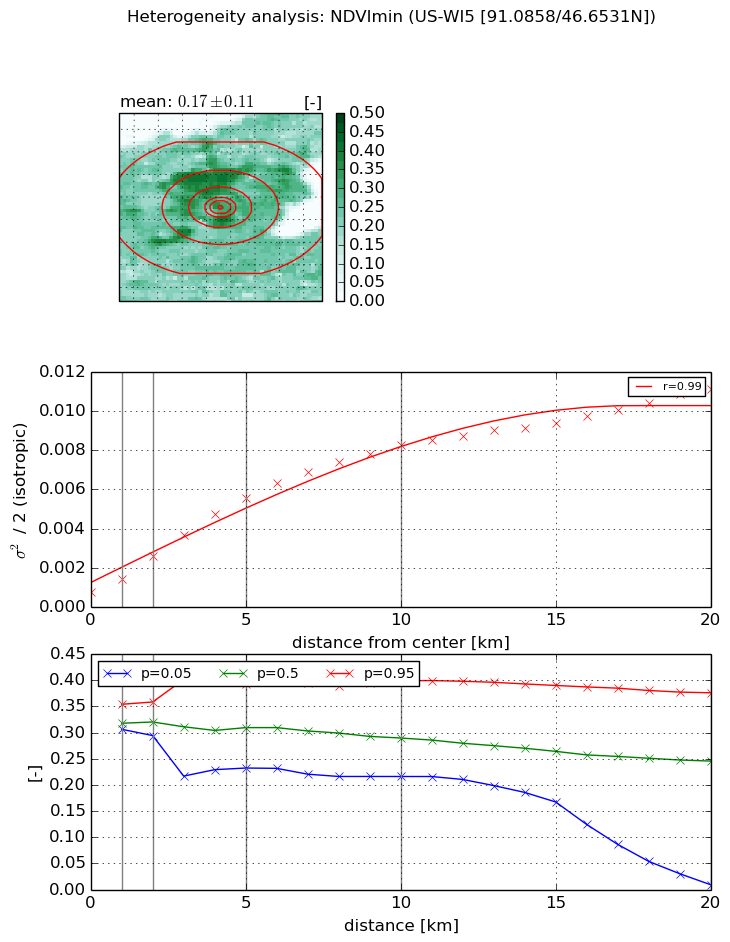
Heterogeneity analysis

The heterogeneity analysis provides information about the spatial and temporal heterogeneity of the site.

Topography


Roman et al. (2009) index


St

2.39793666386

Rcv

0.203966395591

Rse

0.0

Rst

-0.0471092538161

Rsv

-0.999999929534


Height range @ 1km [m]

32

Height range @ 2km [m]

78

Height range @ 5km [m]

90

Height range @ 10km [m]

-999

Height range @ 20km [m]

-999


Variance slope @ 1 km

150

Variance slope @ 2 km

146

Variance slope @ 5 km

133

Variance slope @ 10 km

-999

Variance slope @ 20 km

-999


NDVI (max. NDVI composite)


Roman et al. (2009) index


St

5.71048455857

Rcv

-0.177050683854

Rse

0.0

Rst

-0.138073930395

Rsv

0.210224849397


NDVI range @ 1km [-]

0.03

NDVI range @ 2km [-]

0.05

NDVI range @ 5km [-]

0.05

NDVI range @ 10km [-]

0.06

NDVI range @ 20km [-]

0.44


Variance slope @ 1 km

0.00094181083806

Variance slope @ 2 km

0.0013532992324

Variance slope @ 5 km

0.00156329926117

Variance slope @ 10 km

0.00123658436413

Variance slope @ 20 km

0.000784769634546


NDVI (min. NDVI composite)I


Roman et al. (2009) index


St

13.6022285278

Rcv

-0.0423313010263

Rse

0.0

Rst

0.0345413486088

Rsv

-0.143679445478


NDVI range @ 1km [-]

0.05

NDVI range @ 2km [-]

0.06

NDVI range @ 5km [-]

0.16

NDVI range @ 10km [-]

0.18

NDVI range @ 20km [-]

0.37


NDVI slope @ 1 km

0.000678043896582

NDVI slope @ 2 km

0.000933039616162

NDVI slope @ 5 km

0.00100016314495

NDVI slope @ 10 km

0.000776916478896

NDVI slope @ 20 km

0.000474380682107


Temporal stability analysis

+000 deg (BHR)


BHR statistics

Temporal stability [1/decade]:


abs

rel


Weighted least square:

None


Ordinary least square:

None


Probabilities that GCOS criteria is met:

Weighted least square:

None %

Ordinary least square:

None %


DHR statistics

Temporal stability [1/decade]:


abs

rel


Weighted least square:

None


Ordinary least square:

None


Probabilities that GCOS criteria is met:

Weighted least square:

None %

Ordinary least square:

None %


+057/+063 deg (BHR)


BHR statistics

Temporal stability [1/decade]:


abs

rel


Weighted least square:

None


Ordinary least square:

None


Probabilities that GCOS criteria is met:

Weighted least square:

None %

Ordinary least square:

None %


DHR statistics

Temporal stability [1/decade]:


abs

rel


Weighted least square:

None


Ordinary least square:

None


Probabilities that GCOS criteria is met:

Weighted least square:

None %

Ordinary least square:

None %


Temporal anomaly analyis

The variance of the temporal anomalies provides an additional measure about the stability of the signal AFTER removal of the mean seasonal cylce.

+000 deg


+057/+063 deg