US-WI6


Location

lon / lat [deg]: -91.2982 / 46.6249

Source network: FLUXNET


Geostationary surface albedo (GSA) data


“+000”


“+057/+063”


Landcover information (based on ESA CCI landcover data)


Landcover fractions @ 2km distance


Landcover fractions @ 20 km distance


Legend


Distance to open water bodies [km]:

1.9

Distance to urban areas [km]:

0.3


Radius: 1 km

Number of landcover classes:

8

Dominant landcover type:

130: grassland

Fraction of dominant landcover type [%]:

45.0


Radius: 2 km

Number of landcover classes:

10

Dominant landcover type:

130: grassland

Fraction of dominant landcover type [%]:

44.0


Radius: 5 km

Number of landcover classes:

8

Dominant landcover type:

60: Tree cover, broadleaved, decidous

Fraction of dominant landcover type [%]:

46.0


Radius: 10 km

Number of landcover classes:

8

Dominant landcover type:

60: Tree cover, broadleaved, decidous

Fraction of dominant landcover type [%]:

41.0


Radius: 20 km

Number of landcover classes:

7

Dominant landcover type:

60: Tree cover, broadleaved, decidous

Fraction of dominant landcover type [%]:

32.0


Disturbances


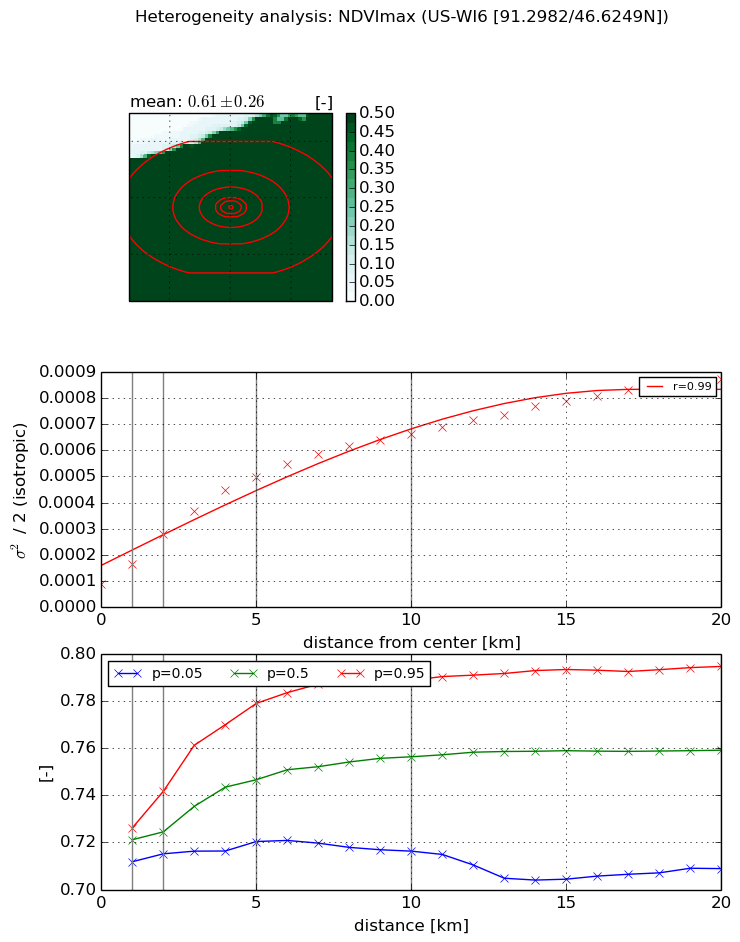
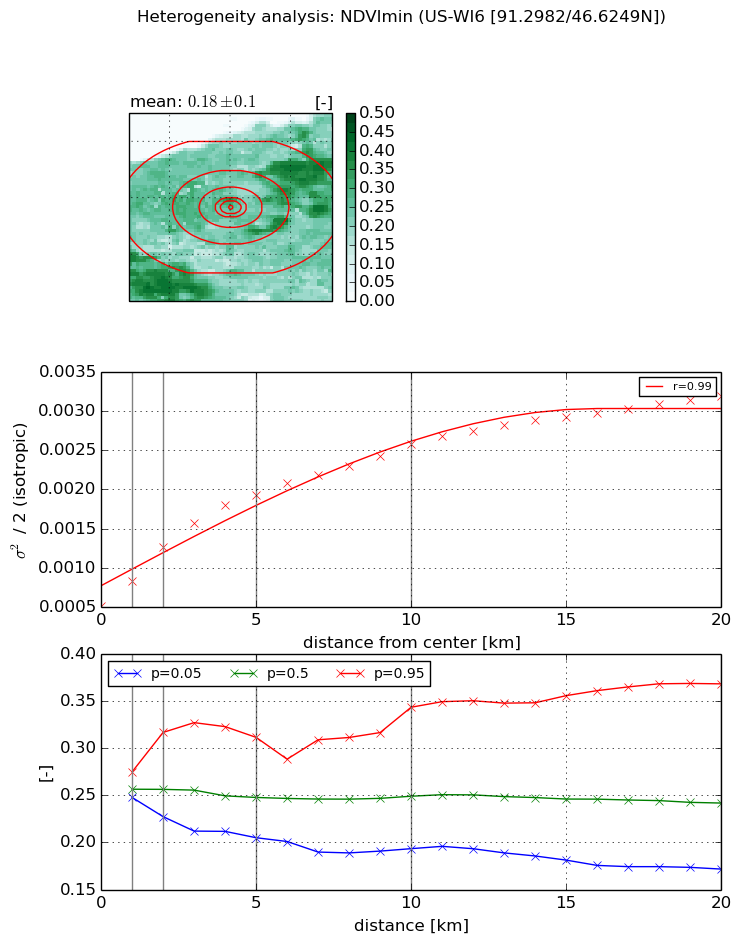
Heterogeneity analysis

The heterogeneity analysis provides information about the spatial and temporal heterogeneity of the site.

Topography


Roman et al. (2009) index


St

1.85747638978

Rcv

0.462946353455

Rse

0.0

Rst

0.152150880193

Rsv

-0.999997319642


Height range @ 1km [m]

40

Height range @ 2km [m]

45

Height range @ 5km [m]

73

Height range @ 10km [m]

-999

Height range @ 20km [m]

-999


Variance slope @ 1 km

208

Variance slope @ 2 km

168

Variance slope @ 5 km

146

Variance slope @ 10 km

-999

Variance slope @ 20 km

-999


NDVI (max. NDVI composite)


Roman et al. (2009) index


St

2.10782043142

Rcv

0.266984593611

Rse

0.0

Rst

-0.222378539629

Rsv

0.933908012289


NDVI range @ 1km [-]

0.01

NDVI range @ 2km [-]

0.03

NDVI range @ 5km [-]

0.06

NDVI range @ 10km [-]

0.07

NDVI range @ 20km [-]

0.09


Variance slope @ 1 km

7.66874031974e-05

Variance slope @ 2 km

9.51193809007e-05

Variance slope @ 5 km

8.56683320688e-05

Variance slope @ 10 km

5.7464318172e-05

Variance slope @ 20 km

3.52682162614e-05


NDVI (min. NDVI composite)I


Roman et al. (2009) index


St

5.46569106832

Rcv

-0.128777397405

Rse

0.0

Rst

0.0495983654037

Rsv

-0.370502679551


NDVI range @ 1km [-]

0.03

NDVI range @ 2km [-]

0.09

NDVI range @ 5km [-]

0.11

NDVI range @ 10km [-]

0.15

NDVI range @ 20km [-]

0.2


NDVI slope @ 1 km

0.000319471184909

NDVI slope @ 2 km

0.000376817389572

NDVI slope @ 5 km

0.000293464039188

NDVI slope @ 10 km

0.000192698297894

NDVI slope @ 20 km

0.000117448344467


Temporal stability analysis

+000 deg (BHR)


BHR statistics

Temporal stability [1/decade]:


abs

rel


Weighted least square:

None


Ordinary least square:

None


Probabilities that GCOS criteria is met:

Weighted least square:

None %

Ordinary least square:

None %


DHR statistics

Temporal stability [1/decade]:


abs

rel


Weighted least square:

None


Ordinary least square:

None


Probabilities that GCOS criteria is met:

Weighted least square:

None %

Ordinary least square:

None %


+057/+063 deg (BHR)


BHR statistics

Temporal stability [1/decade]:


abs

rel


Weighted least square:

None


Ordinary least square:

None


Probabilities that GCOS criteria is met:

Weighted least square:

None %

Ordinary least square:

None %


DHR statistics

Temporal stability [1/decade]:


abs

rel


Weighted least square:

None


Ordinary least square:

None


Probabilities that GCOS criteria is met:

Weighted least square:

None %

Ordinary least square:

None %


Temporal anomaly analyis

The variance of the temporal anomalies provides an additional measure about the stability of the signal AFTER removal of the mean seasonal cylce.

+000 deg


+057/+063 deg