USDA-HOWARD


Location

lon / lat [deg]: -76.8775 / 39.0542

Source network: AERONET


Geostationary surface albedo (GSA) data


“+000”


“+057/+063”


Landcover information (based on ESA CCI landcover data)


Landcover fractions @ 2km distance


Landcover fractions @ 20 km distance


Legend


Distance to open water bodies [km]:

1.02

Distance to urban areas [km]:

0.32


Radius: 1 km

Number of landcover classes:

3

Dominant landcover type:

190: urban areas

Fraction of dominant landcover type [%]:

62.0


Radius: 2 km

Number of landcover classes:

4

Dominant landcover type:

190: urban areas

Fraction of dominant landcover type [%]:

66.0


Radius: 5 km

Number of landcover classes:

6

Dominant landcover type:

190: urban areas

Fraction of dominant landcover type [%]:

62.0


Radius: 10 km

Number of landcover classes:

7

Dominant landcover type:

190: urban areas

Fraction of dominant landcover type [%]:

66.0


Radius: 20 km

Number of landcover classes:

5

Dominant landcover type:

190: urban areas

Fraction of dominant landcover type [%]:

69.0


Disturbances


Heterogeneity analysis

The heterogeneity analysis provides information about the spatial and temporal heterogeneity of the site.

Topography


Roman et al. (2009) index


St

6.32817406108e-07

Rcv

0.470523345562

Rse

0.0

Rst

0.00844074613159

Rsv

4740703.50775


Height range @ 1km [m]

33

Height range @ 2km [m]

38

Height range @ 5km [m]

64

Height range @ 10km [m]

-999

Height range @ 20km [m]

-999


Variance slope @ 1 km

82

Variance slope @ 2 km

78

Variance slope @ 5 km

82

Variance slope @ 10 km

-999

Variance slope @ 20 km

-999


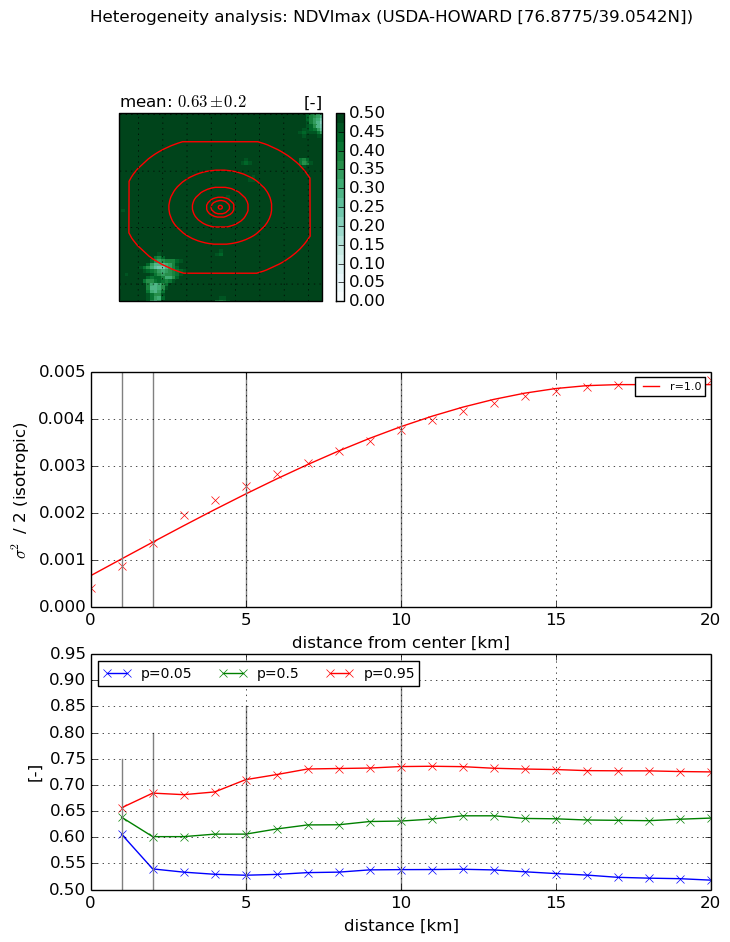
NDVI (max. NDVI composite)


Roman et al. (2009) index


St

3.02839904552e-07

Rcv

0.210349483104

Rse

0.0

Rst

0.128494284606

Rsv

9906223.89023


NDVI range @ 1km [-]

0.05

NDVI range @ 2km [-]

0.14

NDVI range @ 5km [-]

0.18

NDVI range @ 10km [-]

0.2

NDVI range @ 20km [-]

0.21


Variance slope @ 1 km

0.000463275381186

Variance slope @ 2 km

0.00048030388391

Variance slope @ 5 km

0.000446538373066

Variance slope @ 10 km

0.00032737307596

Variance slope @ 20 km

0.000211606854952


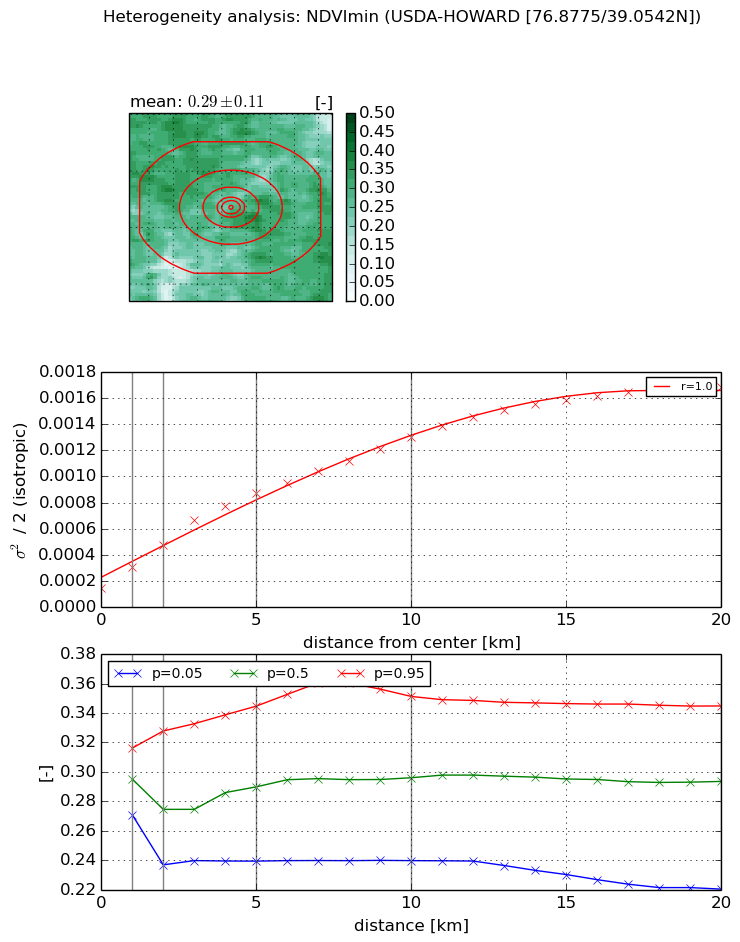
NDVI (min. NDVI composite)I


Roman et al. (2009) index


St

1.11281564898e-05

Rcv

0.0817434761281

Rse

0.0

Rst

0.120894820562

Rsv

269586.229107


NDVI range @ 1km [-]

0.05

NDVI range @ 2km [-]

0.09

NDVI range @ 5km [-]

0.11

NDVI range @ 10km [-]

0.11

NDVI range @ 20km [-]

0.12


NDVI slope @ 1 km

0.000158405371471

NDVI slope @ 2 km

0.00016364389696

NDVI slope @ 5 km

0.000148704768185

NDVI slope @ 10 km

0.000111368588916

NDVI slope @ 20 km

7.46998735028e-05


Temporal stability analysis

+000 deg (BHR)


BHR statistics

Temporal stability [1/decade]:


abs

rel


Weighted least square:

-99999.0


Ordinary least square:

-99999.0


Probabilities that GCOS criteria is met:

Weighted least square:

-99999.0 %

Ordinary least square:

-99999.0 %


DHR statistics

Temporal stability [1/decade]:


abs

rel


Weighted least square:

-99999.0


Ordinary least square:

-99999.0


Probabilities that GCOS criteria is met:

Weighted least square:

-99999.0 %

Ordinary least square:

-99999.0 %


+057/+063 deg (BHR)


BHR statistics

Temporal stability [1/decade]:


abs

rel


Weighted least square:

None


Ordinary least square:

None


Probabilities that GCOS criteria is met:

Weighted least square:

None %

Ordinary least square:

None %


DHR statistics

Temporal stability [1/decade]:


abs

rel


Weighted least square:

None


Ordinary least square:

None


Probabilities that GCOS criteria is met:

Weighted least square:

None %

Ordinary least square:

None %


Temporal anomaly analyis

The variance of the temporal anomalies provides an additional measure about the stability of the signal AFTER removal of the mean seasonal cylce.

+000 deg


+057/+063 deg