U_OF_WISCONSIN_SSEC


Location

lon / lat [deg]: -89.4114 / 43.0725

Source network: AERONET


Geostationary surface albedo (GSA) data


“+000”


“+057/+063”


Landcover information (based on ESA CCI landcover data)


Landcover fractions @ 2km distance


Landcover fractions @ 20 km distance


Legend


Distance to open water bodies [km]:

0.75

Distance to urban areas [km]:

0.16


Radius: 1 km

Number of landcover classes:

2

Dominant landcover type:

190: urban areas

Fraction of dominant landcover type [%]:

86.0


Radius: 2 km

Number of landcover classes:

2

Dominant landcover type:

190: urban areas

Fraction of dominant landcover type [%]:

67.0


Radius: 5 km

Number of landcover classes:

2

Dominant landcover type:

190: urban areas

Fraction of dominant landcover type [%]:

52.0


Radius: 10 km

Number of landcover classes:

5

Dominant landcover type:

190: urban areas

Fraction of dominant landcover type [%]:

53.0


Radius: 20 km

Number of landcover classes:

6

Dominant landcover type:

10: cropland, rainfed

Fraction of dominant landcover type [%]:

54.0


Disturbances


Heterogeneity analysis

The heterogeneity analysis provides information about the spatial and temporal heterogeneity of the site.

Topography


Roman et al. (2009) index


St

19.8200924157

Rcv

0.141744235071

Rse

0.0

Rst

-0.00808127902045

Rsv

-0.00153604049055


Height range @ 1km [m]

24

Height range @ 2km [m]

27

Height range @ 5km [m]

44

Height range @ 10km [m]

-999

Height range @ 20km [m]

-999


Variance slope @ 1 km

60

Variance slope @ 2 km

50

Variance slope @ 5 km

41

Variance slope @ 10 km

-999

Variance slope @ 20 km

-999


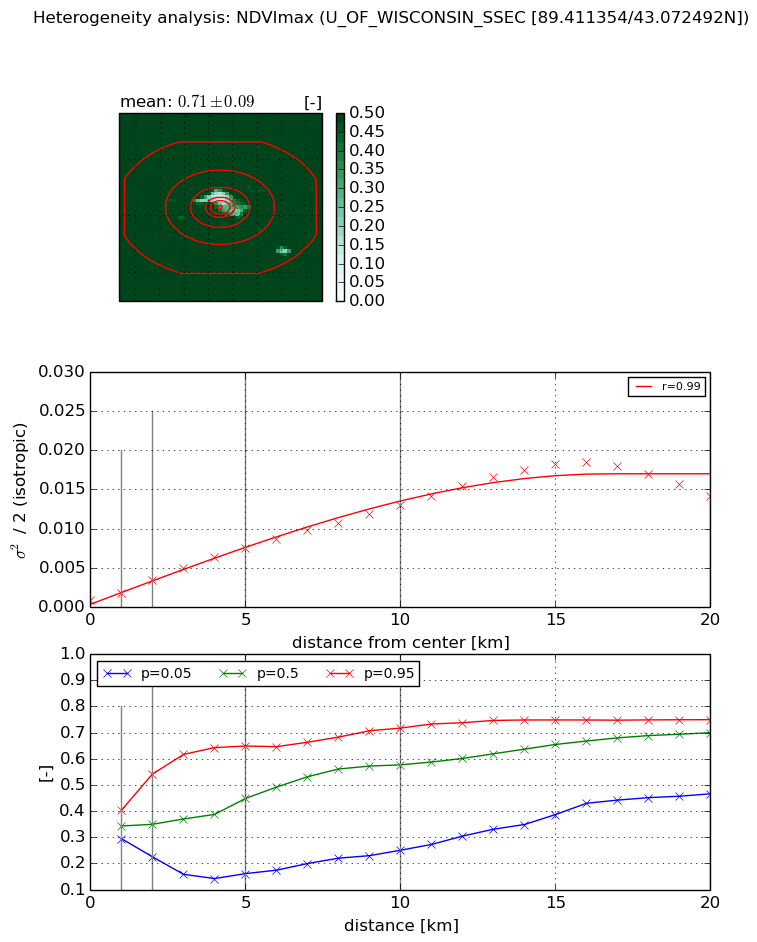
NDVI (max. NDVI composite)


Roman et al. (2009) index


St

17.4218801083

Rcv

-0.0205947127761

Rse

0.0

Rst

-0.136855548242

Rsv

0.0147469979087


NDVI range @ 1km [-]

0.11

NDVI range @ 2km [-]

0.32

NDVI range @ 5km [-]

0.49

NDVI range @ 10km [-]

0.47

NDVI range @ 20km [-]

0.28


Variance slope @ 1 km

0.00100743232891

Variance slope @ 2 km

0.0012810920008

Variance slope @ 5 km

0.00139531242501

Variance slope @ 10 km

0.00122916014995

Variance slope @ 20 km

0.000845610767865


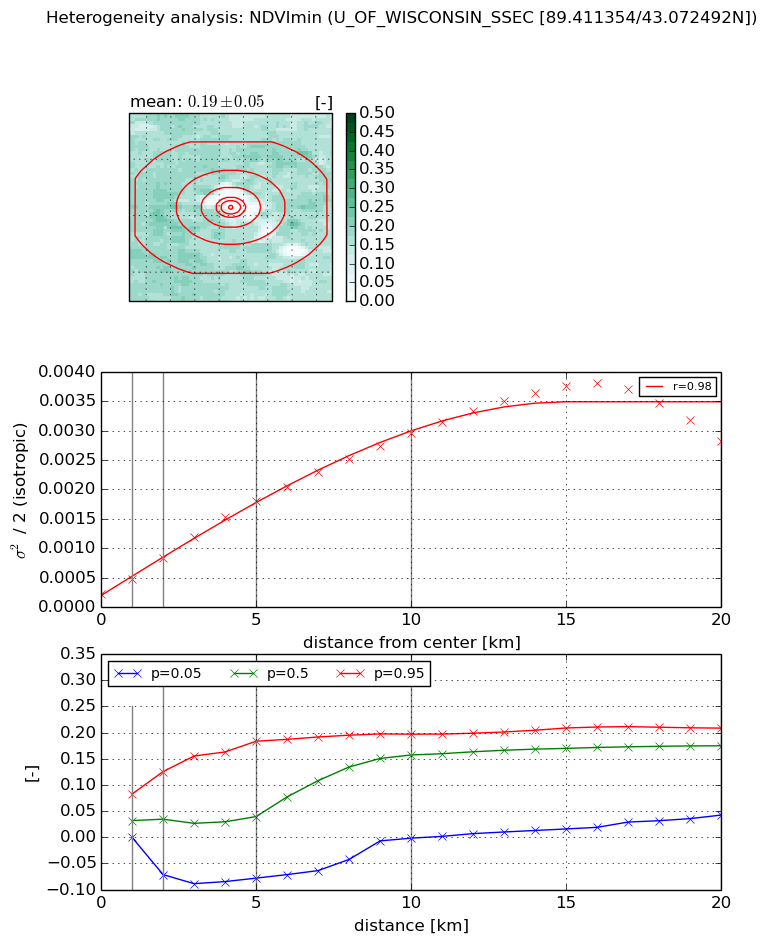
NDVI (min. NDVI composite)I


Roman et al. (2009) index


St

1.66339487743e-07

Rcv

-0.335205933293

Rse

0.0

Rst

0.188989356484

Rsv

18035404.3019


NDVI range @ 1km [-]

0.08

NDVI range @ 2km [-]

0.2

NDVI range @ 5km [-]

0.26

NDVI range @ 10km [-]

0.2

NDVI range @ 20km [-]

0.17


NDVI slope @ 1 km

0.000242583856533

NDVI slope @ 2 km

0.000304953216733

NDVI slope @ 5 km

0.000326763110635

NDVI slope @ 10 km

0.000276907600395

NDVI slope @ 20 km

0.000161601968313


Temporal stability analysis

+000 deg (BHR)


BHR statistics

Temporal stability [1/decade]:


abs

rel


Weighted least square:

None


Ordinary least square:

None


Probabilities that GCOS criteria is met:

Weighted least square:

None %

Ordinary least square:

None %


DHR statistics

Temporal stability [1/decade]:


abs

rel


Weighted least square:

None


Ordinary least square:

None


Probabilities that GCOS criteria is met:

Weighted least square:

None %

Ordinary least square:

None %


+057/+063 deg (BHR)


BHR statistics

Temporal stability [1/decade]:


abs

rel


Weighted least square:

None


Ordinary least square:

None


Probabilities that GCOS criteria is met:

Weighted least square:

None %

Ordinary least square:

None %


DHR statistics

Temporal stability [1/decade]:


abs

rel


Weighted least square:

None


Ordinary least square:

None


Probabilities that GCOS criteria is met:

Weighted least square:

None %

Ordinary least square:

None %


Temporal anomaly analyis

The variance of the temporal anomalies provides an additional measure about the stability of the signal AFTER removal of the mean seasonal cylce.

+000 deg


+057/+063 deg