VALLADOLID


Location

lon / lat [deg]: -4.7058 / 41.6636

Source network: AERONET


Geostationary surface albedo (GSA) data


“+000”


“+057/+063”


Landcover information (based on ESA CCI landcover data)


Landcover fractions @ 2km distance


Landcover fractions @ 20 km distance


Legend


Distance to open water bodies [km]:

10.26

Distance to urban areas [km]:

0.15


Radius: 1 km

Number of landcover classes:

2

Dominant landcover type:

190: urban areas

Fraction of dominant landcover type [%]:

98.0


Radius: 2 km

Number of landcover classes:

3

Dominant landcover type:

190: urban areas

Fraction of dominant landcover type [%]:

89.0


Radius: 5 km

Number of landcover classes:

3

Dominant landcover type:

190: urban areas

Fraction of dominant landcover type [%]:

47.0


Radius: 10 km

Number of landcover classes:

5

Dominant landcover type:

10: cropland, rainfed

Fraction of dominant landcover type [%]:

56.0


Radius: 20 km

Number of landcover classes:

7

Dominant landcover type:

10: cropland, rainfed

Fraction of dominant landcover type [%]:

62.0


Disturbances


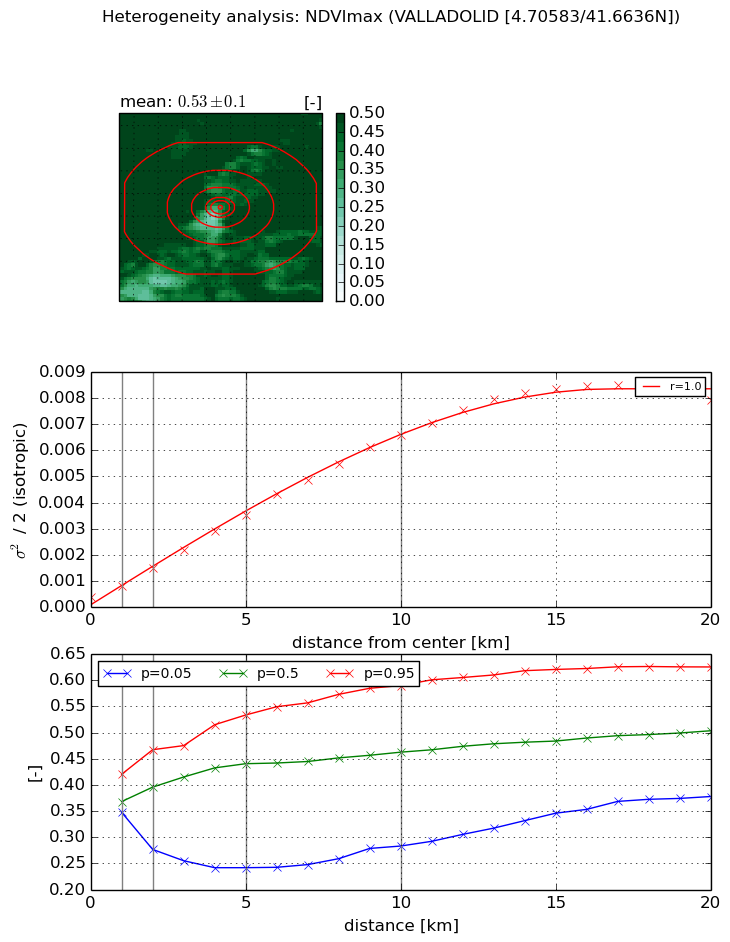
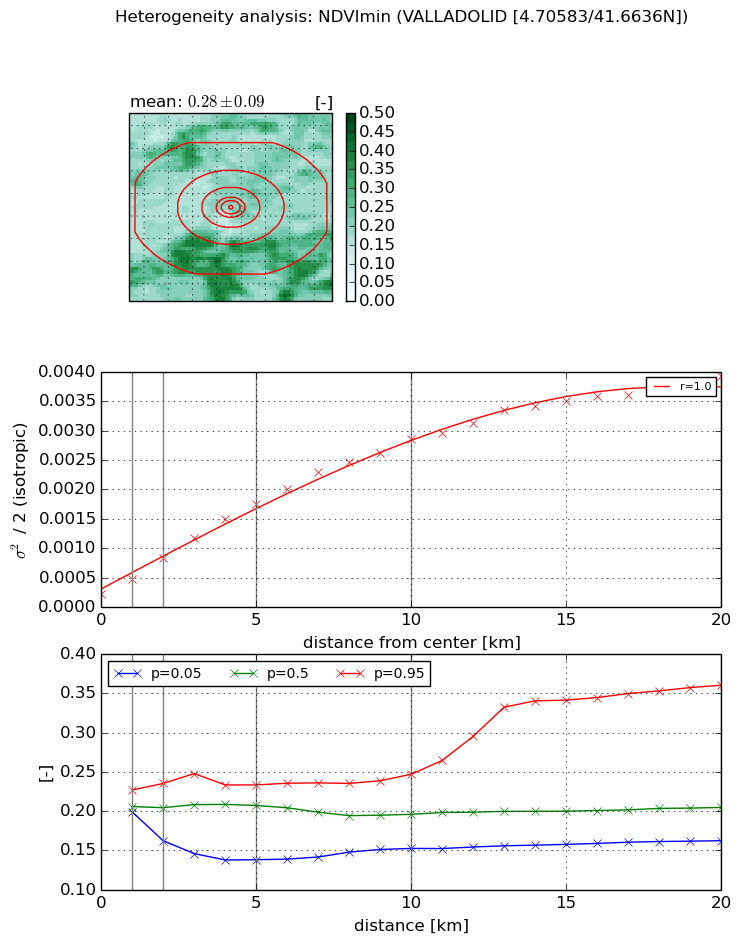
Heterogeneity analysis

The heterogeneity analysis provides information about the spatial and temporal heterogeneity of the site.

Topography


Roman et al. (2009) index


St

0.000126335379291

Rcv

1.40947810123

Rse

0.0

Rst

0.0188238778371

Rsv

23744.8889753


Height range @ 1km [m]

10

Height range @ 2km [m]

19

Height range @ 5km [m]

77

Height range @ 10km [m]

-999

Height range @ 20km [m]

-999


Variance slope @ 1 km

320

Variance slope @ 2 km

328

Variance slope @ 5 km

244

Variance slope @ 10 km

-999

Variance slope @ 20 km

-999


NDVI (max. NDVI composite)


Roman et al. (2009) index


St

15.575449907

Rcv

0.125621547763

Rse

0.0

Rst

-0.018992896092

Rsv

0.0479963646877


NDVI range @ 1km [-]

0.07

NDVI range @ 2km [-]

0.19

NDVI range @ 5km [-]

0.29

NDVI range @ 10km [-]

0.31

NDVI range @ 20km [-]

0.25


Variance slope @ 1 km

0.000446832213288

Variance slope @ 2 km

0.000564215997872

Variance slope @ 5 km

0.000652951270686

Variance slope @ 10 km

0.00064352140416

Variance slope @ 20 km

0.00042623544795


NDVI (min. NDVI composite)I


Roman et al. (2009) index


St

8.47720716236

Rcv

0.0136842818107

Rse

0.0

Rst

-0.0263586105161

Rsv

0.313847244194


NDVI range @ 1km [-]

0.03

NDVI range @ 2km [-]

0.07

NDVI range @ 5km [-]

0.1

NDVI range @ 10km [-]

0.09

NDVI range @ 20km [-]

0.2


NDVI slope @ 1 km

0.00025459408404

NDVI slope @ 2 km

0.000308271313566

NDVI slope @ 5 km

0.000315467931635

NDVI slope @ 10 km

0.00026723886101

NDVI slope @ 20 km

0.000180299039675


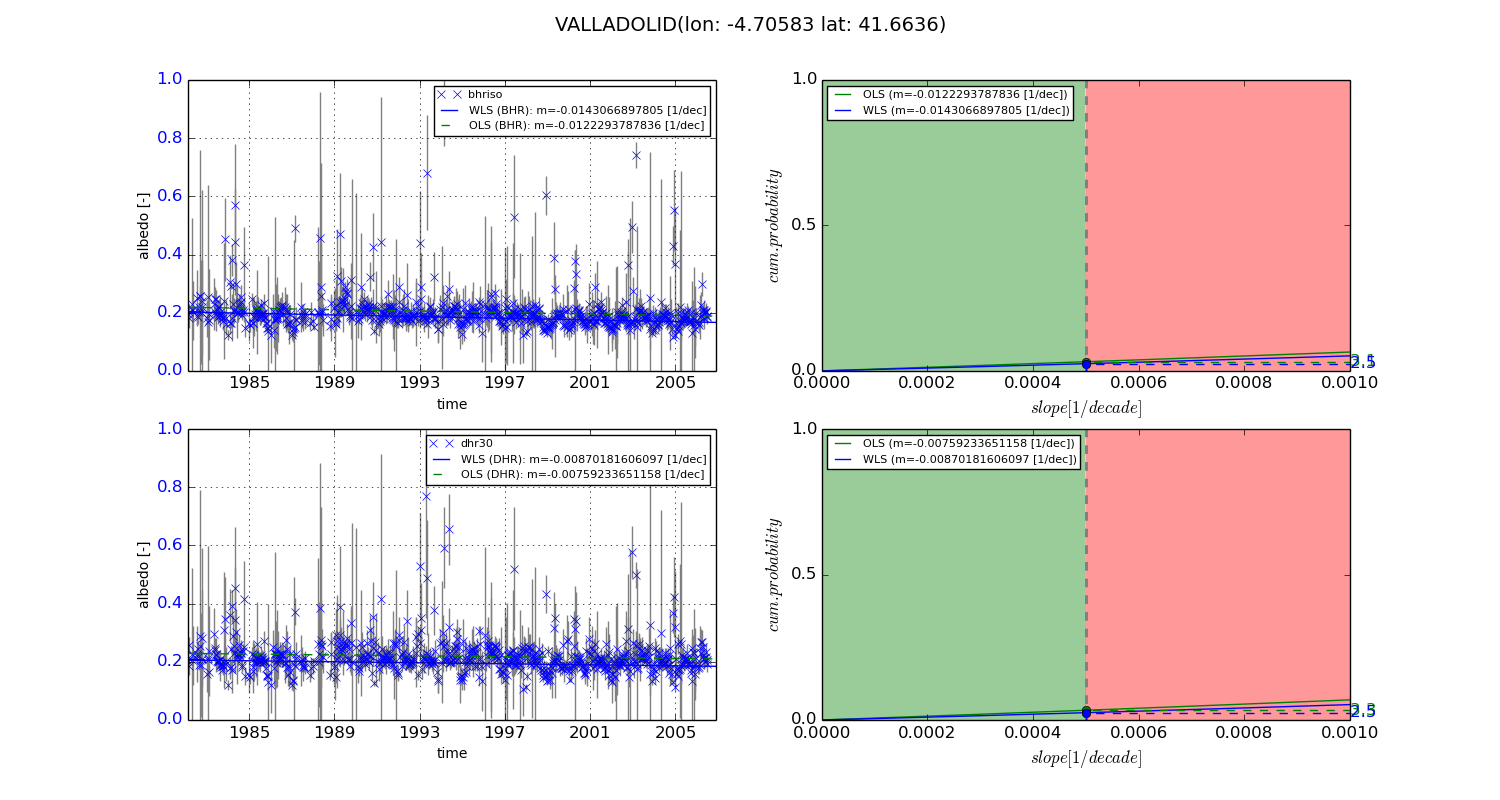
Temporal stability analysis

+000 deg (BHR)


BHR statistics

Temporal stability [1/decade]:


abs

rel


Weighted least square:

-0.0143066897805


Ordinary least square:

-0.0122293787836


Probabilities that GCOS criteria is met:

Weighted least square:

2.5 %

Ordinary least square:

3.1 %


DHR statistics

Temporal stability [1/decade]:


abs

rel


Weighted least square:

-0.00870181606097


Ordinary least square:

-0.00759233651158


Probabilities that GCOS criteria is met:

Weighted least square:

2.5 %

Ordinary least square:

3.3 %


+057/+063 deg (BHR)


BHR statistics

Temporal stability [1/decade]:


abs

rel


Weighted least square:

-99999.0


Ordinary least square:

-99999.0


Probabilities that GCOS criteria is met:

Weighted least square:

-99999.0 %

Ordinary least square:

-99999.0 %


DHR statistics

Temporal stability [1/decade]:


abs

rel


Weighted least square:

-99999.0


Ordinary least square:

-99999.0


Probabilities that GCOS criteria is met:

Weighted least square:

-99999.0 %

Ordinary least square:

-99999.0 %


Temporal anomaly analyis

The variance of the temporal anomalies provides an additional measure about the stability of the signal AFTER removal of the mean seasonal cylce.
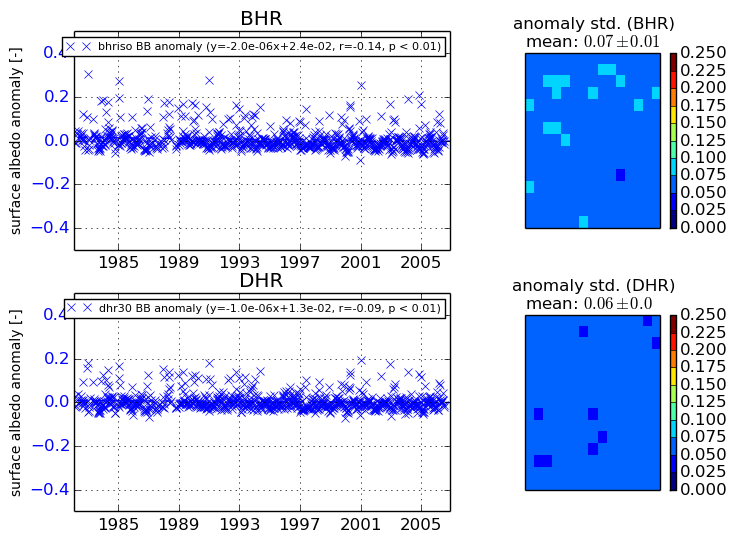
+000 deg


+057/+063 deg