VALLE_MATAMOROS


Location

lon / lat [deg]: -6.749 / 38.413

Source network: ALBEDOVAL2


Geostationary surface albedo (GSA) data


“+000”


“+057/+063”


Landcover information (based on ESA CCI landcover data)


Landcover fractions @ 2km distance


Landcover fractions @ 20 km distance


Legend


Distance to open water bodies [km]:

7.12

Distance to urban areas [km]:

6.3


Radius: 1 km

Number of landcover classes:

4

Dominant landcover type:

40: mosaic natural vegetation (tree, shrub, herbaceous cover) (>50%) / cropland (<50%)

Fraction of dominant landcover type [%]:

34.0


Radius: 2 km

Number of landcover classes:

5

Dominant landcover type:

30: mosaic cropland (>50%), natural veg. (< 50%)

Fraction of dominant landcover type [%]:

38.0


Radius: 5 km

Number of landcover classes:

5

Dominant landcover type:

40: mosaic natural vegetation (tree, shrub, herbaceous cover) (>50%) / cropland (<50%)

Fraction of dominant landcover type [%]:

34.0


Radius: 10 km

Number of landcover classes:

8

Dominant landcover type:

10: cropland, rainfed

Fraction of dominant landcover type [%]:

36.0


Radius: 20 km

Number of landcover classes:

9

Dominant landcover type:

10: cropland, rainfed

Fraction of dominant landcover type [%]:

51.0


Disturbances


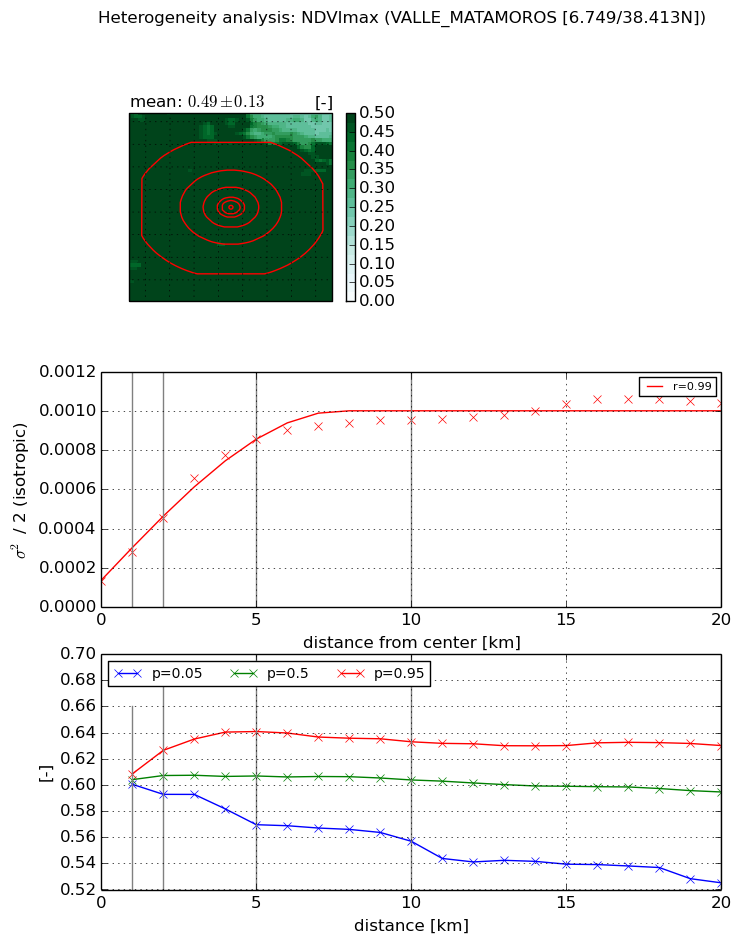
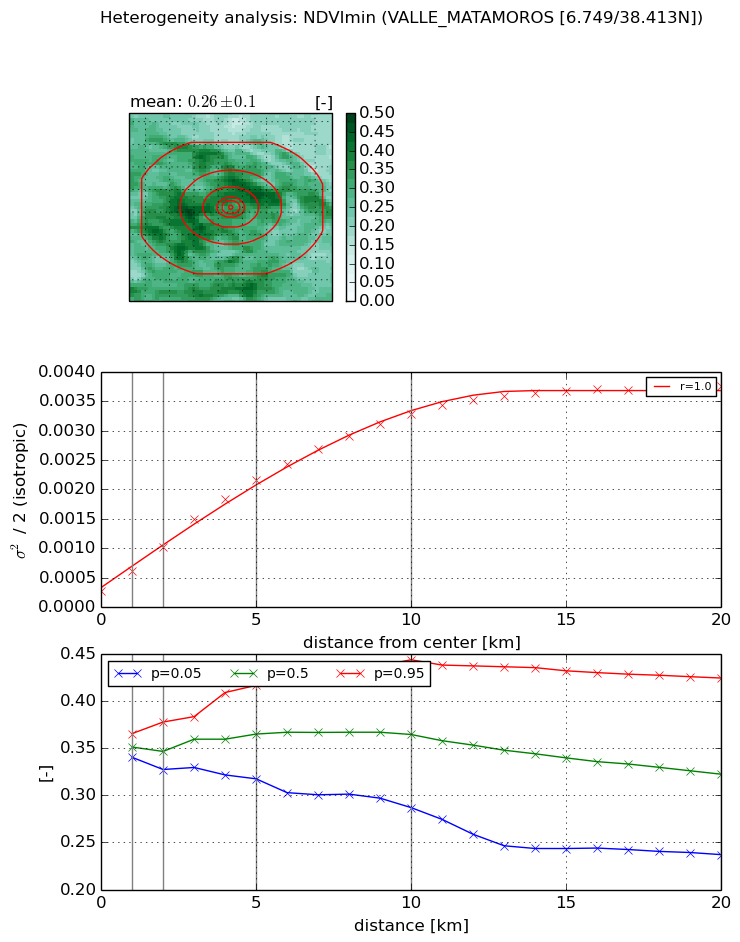
Heterogeneity analysis

The heterogeneity analysis provides information about the spatial and temporal heterogeneity of the site.

Topography


Roman et al. (2009) index


St

1.61783801685

Rcv

0.854245837953

Rse

0.0

Rst

-8.07193087586e-05

Rsv

-1.0


Height range @ 1km [m]

62

Height range @ 2km [m]

86

Height range @ 5km [m]

266

Height range @ 10km [m]

-999

Height range @ 20km [m]

-999


Variance slope @ 1 km

1168

Variance slope @ 2 km

1173

Variance slope @ 5 km

1161

Variance slope @ 10 km

-999

Variance slope @ 20 km

-999


NDVI (max. NDVI composite)


Roman et al. (2009) index


St

1.74938035639

Rcv

0.643048919806

Rse

0.0

Rst

-0.0560235042495

Rsv

1.01582050305


NDVI range @ 1km [-]

0.01

NDVI range @ 2km [-]

0.03

NDVI range @ 5km [-]

0.07

NDVI range @ 10km [-]

0.08

NDVI range @ 20km [-]

0.11


Variance slope @ 1 km

0.000144964000756

Variance slope @ 2 km

0.000159791191034

Variance slope @ 5 km

0.000151500565513

Variance slope @ 10 km

8.10113926106e-05

Variance slope @ 20 km

3.49100074495e-05


NDVI (min. NDVI composite)I


Roman et al. (2009) index


St

1.28085501782

Rcv

0.669334471837

Rse

0.0

Rst

-0.672852075215

Rsv

-0.999998913641


NDVI range @ 1km [-]

0.03

NDVI range @ 2km [-]

0.05

NDVI range @ 5km [-]

0.1

NDVI range @ 10km [-]

0.16

NDVI range @ 20km [-]

0.19


NDVI slope @ 1 km

0.000338554465336

NDVI slope @ 2 km

0.000368094911533

NDVI slope @ 5 km

0.000385116025337

NDVI slope @ 10 km

0.000305733142809

NDVI slope @ 20 km

0.000165808378898


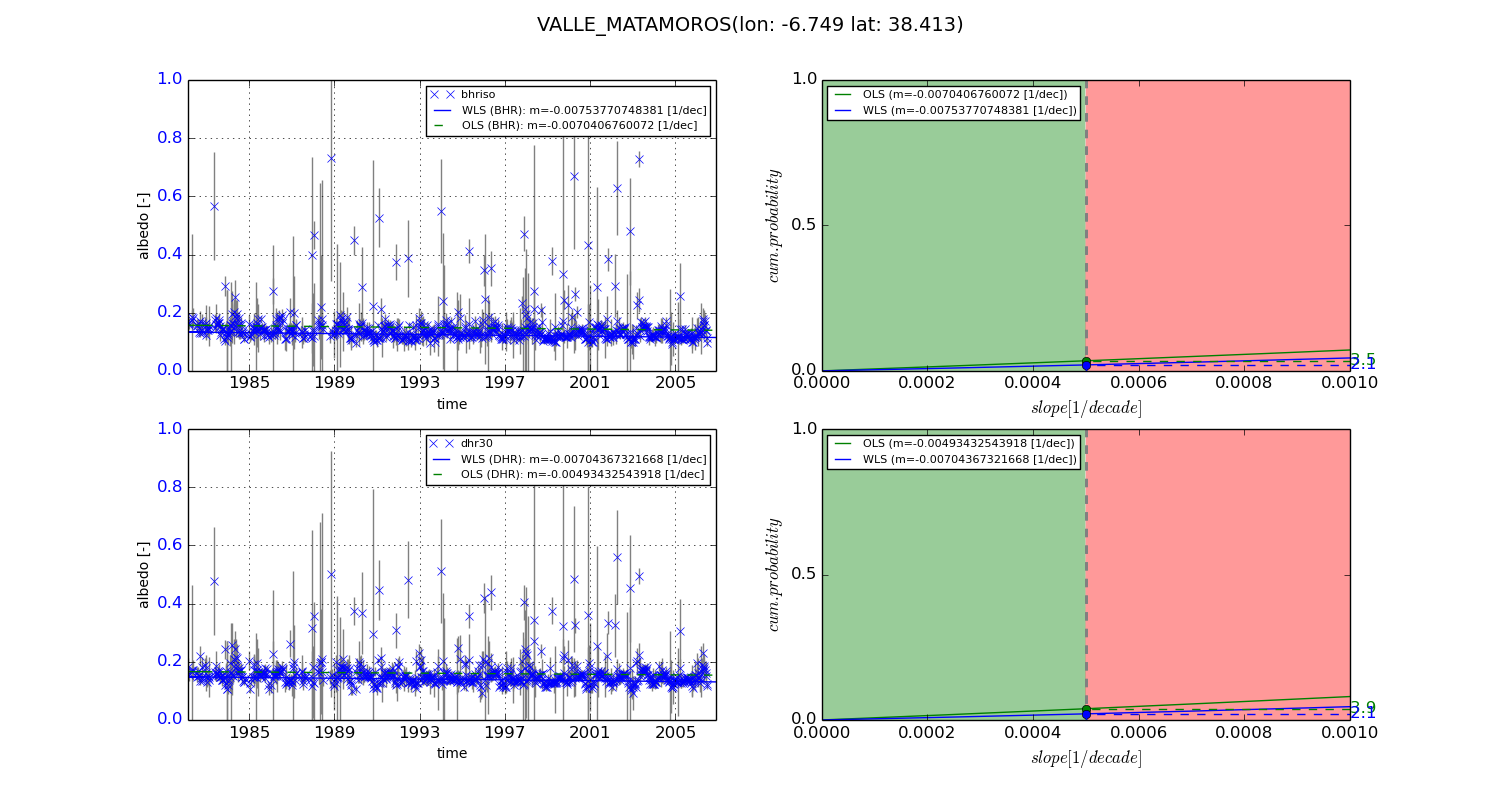
Temporal stability analysis

+000 deg (BHR)


BHR statistics

Temporal stability [1/decade]:


abs

rel


Weighted least square:

-0.00753770748381


Ordinary least square:

-0.0070406760072


Probabilities that GCOS criteria is met:

Weighted least square:

2.1 %

Ordinary least square:

3.5 %


DHR statistics

Temporal stability [1/decade]:


abs

rel


Weighted least square:

-0.00704367321668


Ordinary least square:

-0.00493432543918


Probabilities that GCOS criteria is met:

Weighted least square:

2.1 %

Ordinary least square:

3.9 %


+057/+063 deg (BHR)


BHR statistics

Temporal stability [1/decade]:


abs

rel


Weighted least square:

-99999.0


Ordinary least square:

-99999.0


Probabilities that GCOS criteria is met:

Weighted least square:

-99999.0 %

Ordinary least square:

-99999.0 %


DHR statistics

Temporal stability [1/decade]:


abs

rel


Weighted least square:

-99999.0


Ordinary least square:

-99999.0


Probabilities that GCOS criteria is met:

Weighted least square:

-99999.0 %

Ordinary least square:

-99999.0 %


Temporal anomaly analyis

The variance of the temporal anomalies provides an additional measure about the stability of the signal AFTER removal of the mean seasonal cylce.
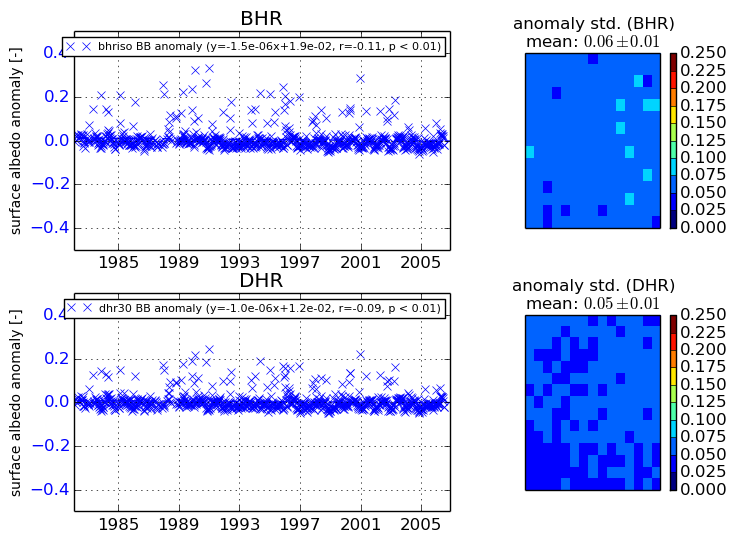
+000 deg


+057/+063 deg