VIENTIANE


Location

lon / lat [deg]: 102.5696 / 17.9923

Source network: AERONET


Geostationary surface albedo (GSA) data


“+000”


“+057/+063”


Landcover information (based on ESA CCI landcover data)


Landcover fractions @ 2km distance


Landcover fractions @ 20 km distance


Legend


Distance to open water bodies [km]:

2.4

Distance to urban areas [km]:

0.15


Radius: 1 km

Number of landcover classes:

4

Dominant landcover type:

190: urban areas

Fraction of dominant landcover type [%]:

44.0


Radius: 2 km

Number of landcover classes:

4

Dominant landcover type:

190: urban areas

Fraction of dominant landcover type [%]:

39.0


Radius: 5 km

Number of landcover classes:

6

Dominant landcover type:

10: cropland, rainfed

Fraction of dominant landcover type [%]:

45.0


Radius: 10 km

Number of landcover classes:

7

Dominant landcover type:

10: cropland, rainfed

Fraction of dominant landcover type [%]:

46.0


Radius: 20 km

Number of landcover classes:

8

Dominant landcover type:

10: cropland, rainfed

Fraction of dominant landcover type [%]:

44.0


Disturbances


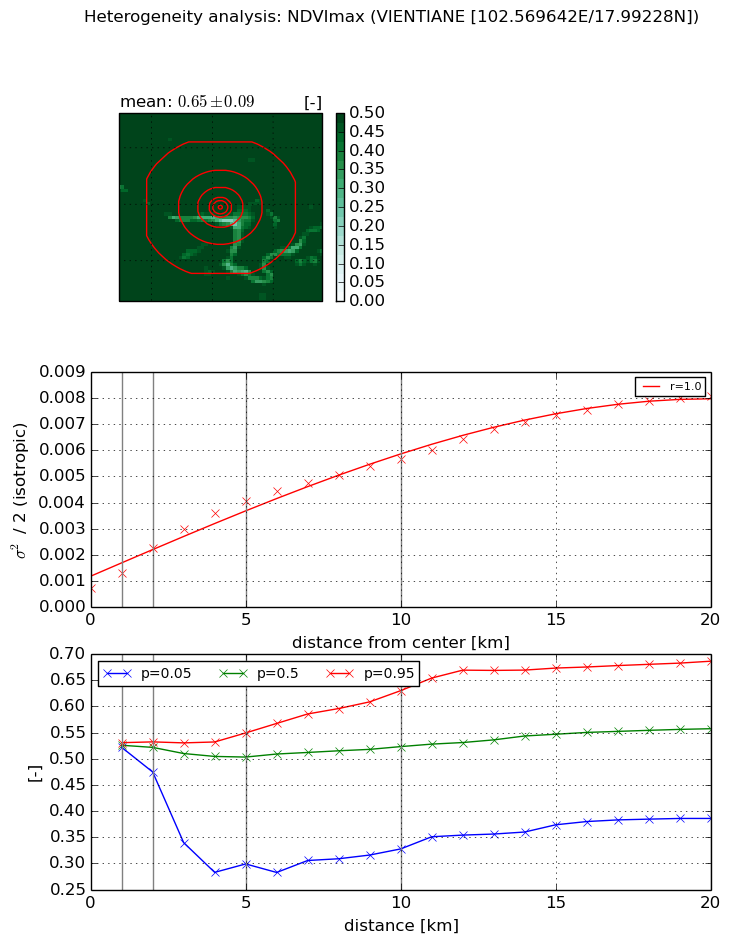
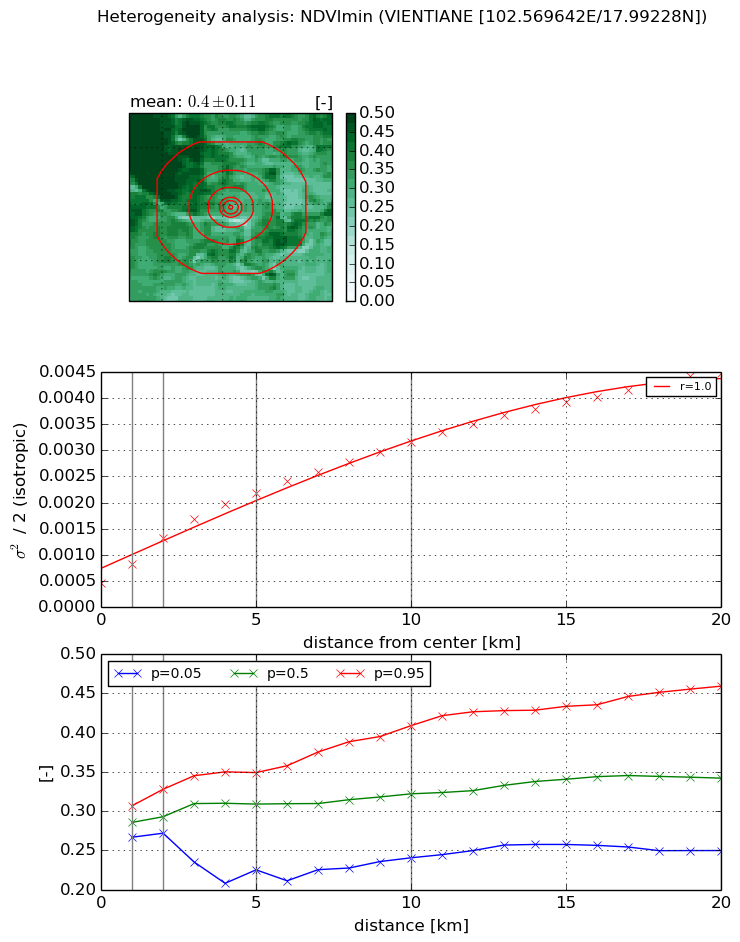
Heterogeneity analysis

The heterogeneity analysis provides information about the spatial and temporal heterogeneity of the site.

Topography


Roman et al. (2009) index


St

1.58900696674e-05

Rcv

0.429898351914

Rse

0.0

Rst

-0.248762242652

Rsv

188796.479741


Height range @ 1km [m]

6

Height range @ 2km [m]

7

Height range @ 5km [m]

16

Height range @ 10km [m]

-999

Height range @ 20km [m]

-999


Variance slope @ 1 km

19

Variance slope @ 2 km

14

Variance slope @ 5 km

8

Variance slope @ 10 km

-999

Variance slope @ 20 km

-999


NDVI (max. NDVI composite)


Roman et al. (2009) index


St

2.40899520711e-07

Rcv

0.65755204541

Rse

0.0

Rst

0.136656163088

Rsv

12453324.1072


NDVI range @ 1km [-]

0.01

NDVI range @ 2km [-]

0.06

NDVI range @ 5km [-]

0.25

NDVI range @ 10km [-]

0.3

NDVI range @ 20km [-]

0.3


Variance slope @ 1 km

0.000595727184506

Variance slope @ 2 km

0.000773923621791

Variance slope @ 5 km

0.000693167726173

Variance slope @ 10 km

0.000489072361513

Variance slope @ 20 km

0.000353890685153


NDVI (min. NDVI composite)I


Roman et al. (2009) index


St

1.20754209812e-06

Rcv

0.475802423608

Rse

0.0

Rst

0.152850335945

Rsv

2484384.80574


NDVI range @ 1km [-]

0.04

NDVI range @ 2km [-]

0.06

NDVI range @ 5km [-]

0.12

NDVI range @ 10km [-]

0.17

NDVI range @ 20km [-]

0.21


NDVI slope @ 1 km

0.000350473132629

NDVI slope @ 2 km

0.000432223640904

NDVI slope @ 5 km

0.00035535004583

NDVI slope @ 10 km

0.000260519384357

NDVI slope @ 20 km

0.000188510880332


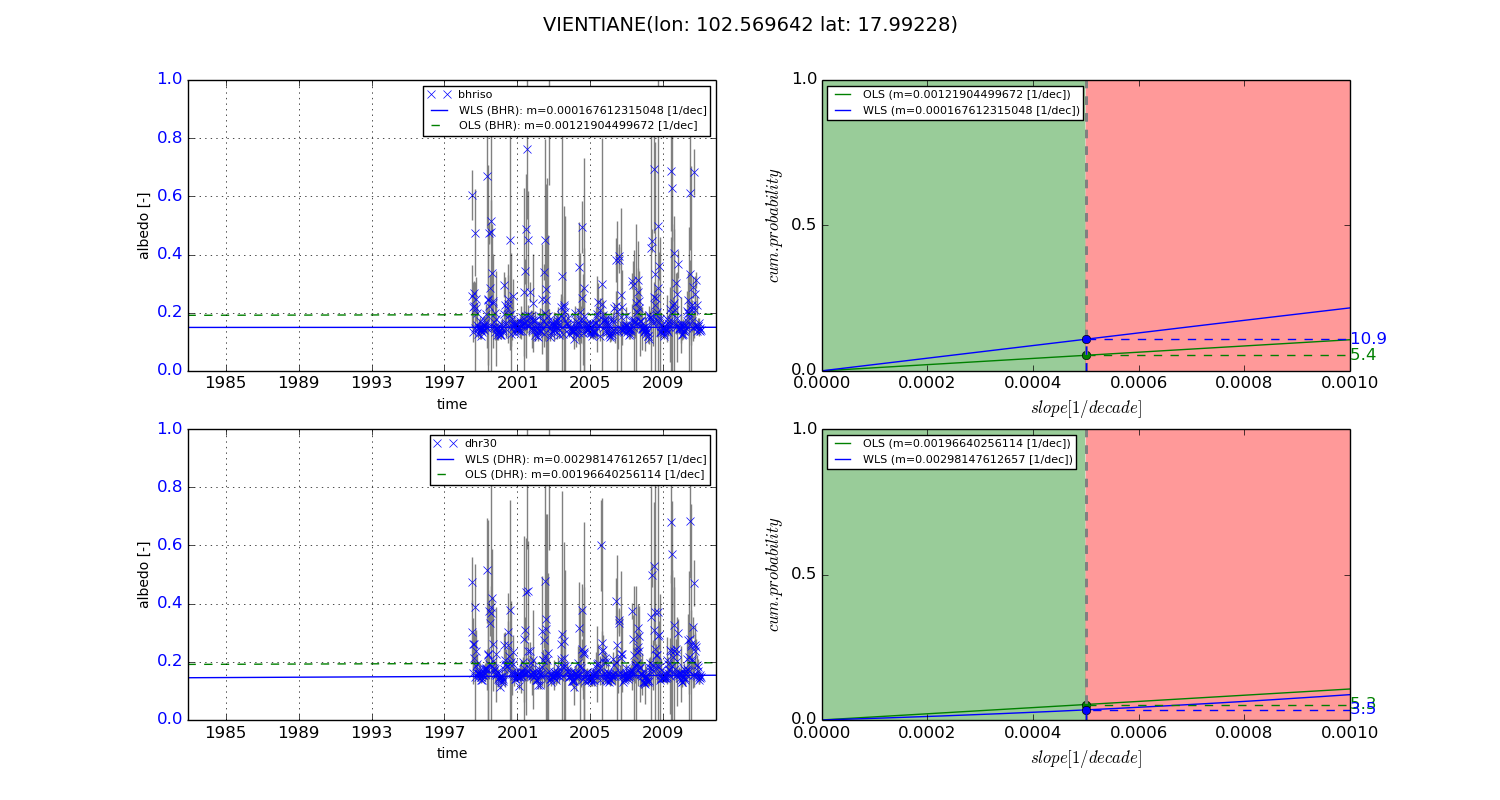
Temporal stability analysis

+000 deg (BHR)


BHR statistics

Temporal stability [1/decade]:


abs

rel


Weighted least square:

None


Ordinary least square:

None


Probabilities that GCOS criteria is met:

Weighted least square:

None %

Ordinary least square:

None %


DHR statistics

Temporal stability [1/decade]:


abs

rel


Weighted least square:

None


Ordinary least square:

None


Probabilities that GCOS criteria is met:

Weighted least square:

None %

Ordinary least square:

None %


+057/+063 deg (BHR)


BHR statistics

Temporal stability [1/decade]:


abs

rel


Weighted least square:

0.000167612315048


Ordinary least square:

0.00121904499672


Probabilities that GCOS criteria is met:

Weighted least square:

10.9 %

Ordinary least square:

5.4 %


DHR statistics

Temporal stability [1/decade]:


abs

rel


Weighted least square:

0.00298147612657


Ordinary least square:

0.00196640256114


Probabilities that GCOS criteria is met:

Weighted least square:

3.5 %

Ordinary least square:

5.3 %


Temporal anomaly analyis

The variance of the temporal anomalies provides an additional measure about the stability of the signal AFTER removal of the mean seasonal cylce.

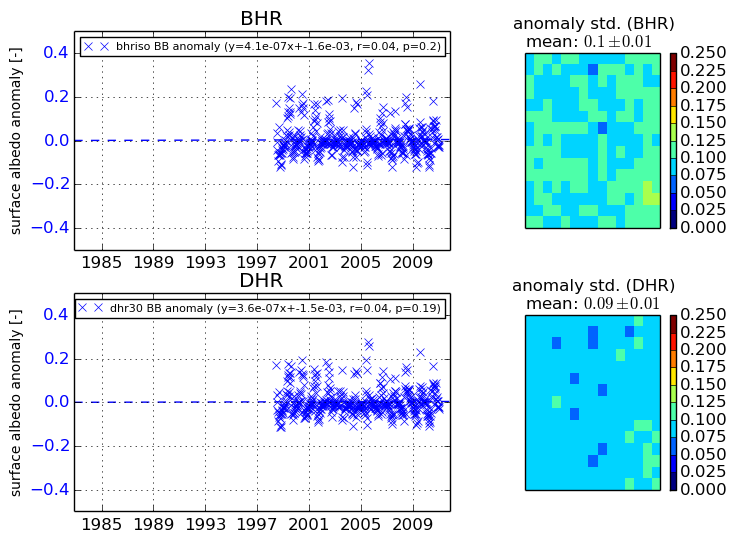
+000 deg


+057/+063 deg