VINON


Location

lon / lat [deg]: 5.7586 / 43.7092

Source network: AERONET


Geostationary surface albedo (GSA) data


“+000”


“+057/+063”


Landcover information (based on ESA CCI landcover data)


Landcover fractions @ 2km distance


Landcover fractions @ 20 km distance


Legend


Distance to open water bodies [km]:

1.03

Distance to urban areas [km]:

0.27


Radius: 1 km

Number of landcover classes:

5

Dominant landcover type:

10: cropland, rainfed

Fraction of dominant landcover type [%]:

49.0


Radius: 2 km

Number of landcover classes:

12

Dominant landcover type:

10: cropland, rainfed

Fraction of dominant landcover type [%]:

27.0


Radius: 5 km

Number of landcover classes:

12

Dominant landcover type:

10: cropland, rainfed

Fraction of dominant landcover type [%]:

40.0


Radius: 10 km

Number of landcover classes:

11

Dominant landcover type:

10: cropland, rainfed

Fraction of dominant landcover type [%]:

51.0


Radius: 20 km

Number of landcover classes:

10

Dominant landcover type:

10: cropland, rainfed

Fraction of dominant landcover type [%]:

48.0


Disturbances


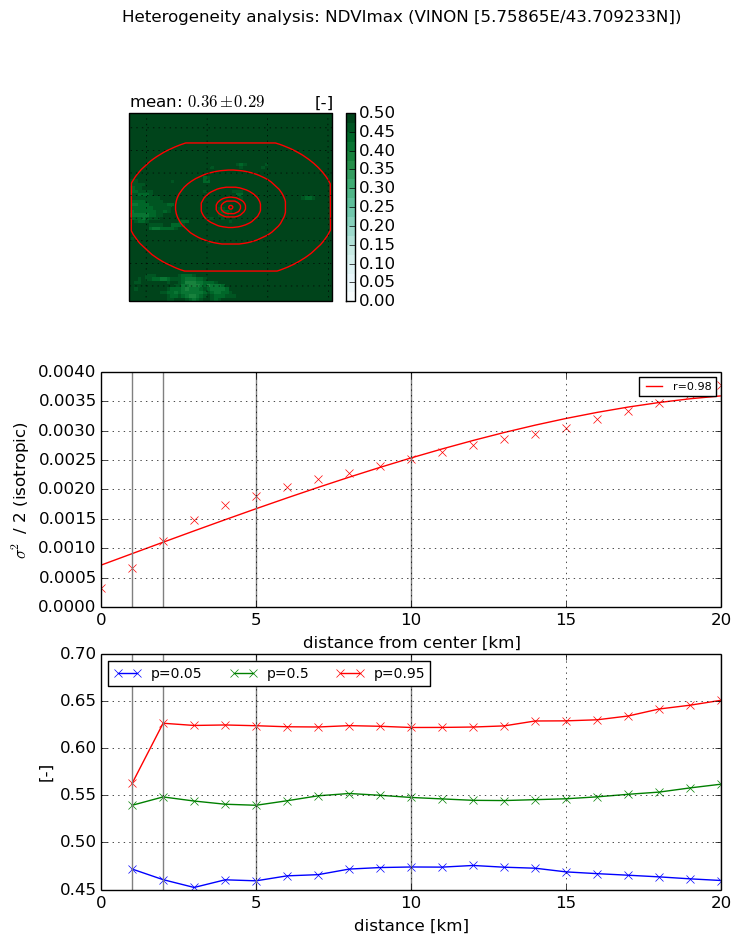
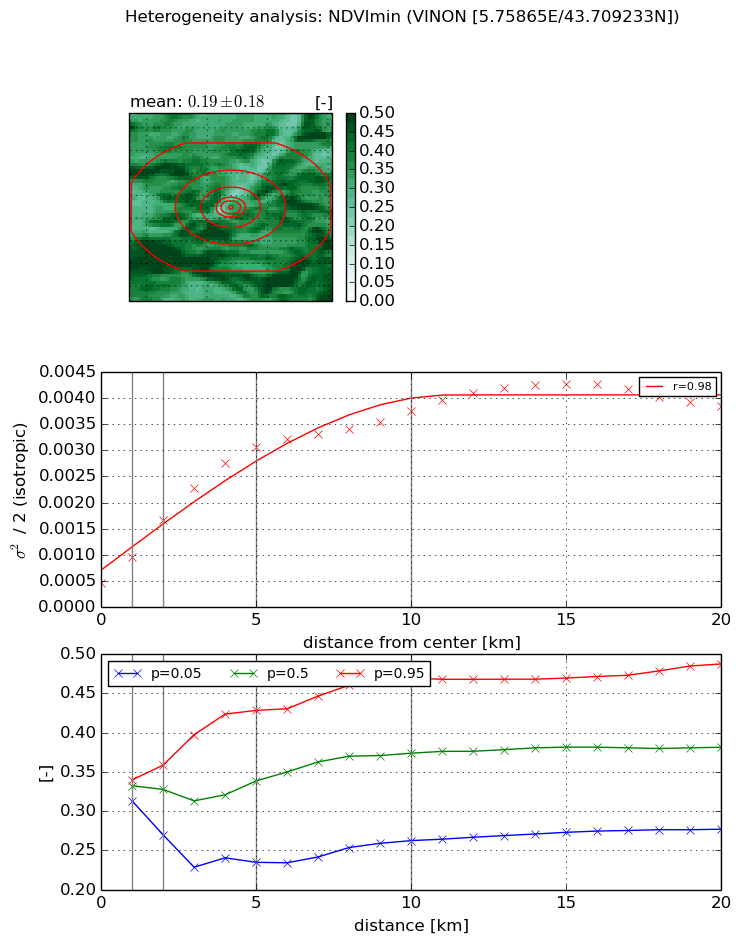
Heterogeneity analysis

The heterogeneity analysis provides information about the spatial and temporal heterogeneity of the site.

Topography


Roman et al. (2009) index


St

0.00291549952633

Rcv

0.154274206193

Rse

0.0

Rst

0.0023597304685

Rsv

1028.82655502


Height range @ 1km [m]

41

Height range @ 2km [m]

108

Height range @ 5km [m]

154

Height range @ 10km [m]

-999

Height range @ 20km [m]

-999


Variance slope @ 1 km

1059

Variance slope @ 2 km

933

Variance slope @ 5 km

686

Variance slope @ 10 km

-999

Variance slope @ 20 km

-999


NDVI (max. NDVI composite)


Roman et al. (2009) index


St

7.2829247527

Rcv

-0.0392609768743

Rse

0.0

Rst

0.117439629019

Rsv

-0.255221815642


NDVI range @ 1km [-]

0.09

NDVI range @ 2km [-]

0.17

NDVI range @ 5km [-]

0.16

NDVI range @ 10km [-]

0.15

NDVI range @ 20km [-]

0.19


Variance slope @ 1 km

0.0003452310162

Variance slope @ 2 km

0.000401526720741

Variance slope @ 5 km

0.000323436105767

Variance slope @ 10 km

0.000208918308895

Variance slope @ 20 km

0.0001482141823


NDVI (min. NDVI composite)I


Roman et al. (2009) index


St

7.0822737331

Rcv

0.155401786494

Rse

0.0

Rst

-0.00156089262999

Rsv

-0.266630098148


NDVI range @ 1km [-]

0.03

NDVI range @ 2km [-]

0.09

NDVI range @ 5km [-]

0.19

NDVI range @ 10km [-]

0.21

NDVI range @ 20km [-]

0.21


NDVI slope @ 1 km

0.000497196340233

NDVI slope @ 2 km

0.000601934202235

NDVI slope @ 5 km

0.000542564928393

NDVI slope @ 10 km

0.000314120839149

NDVI slope @ 20 km

0.000151351684978


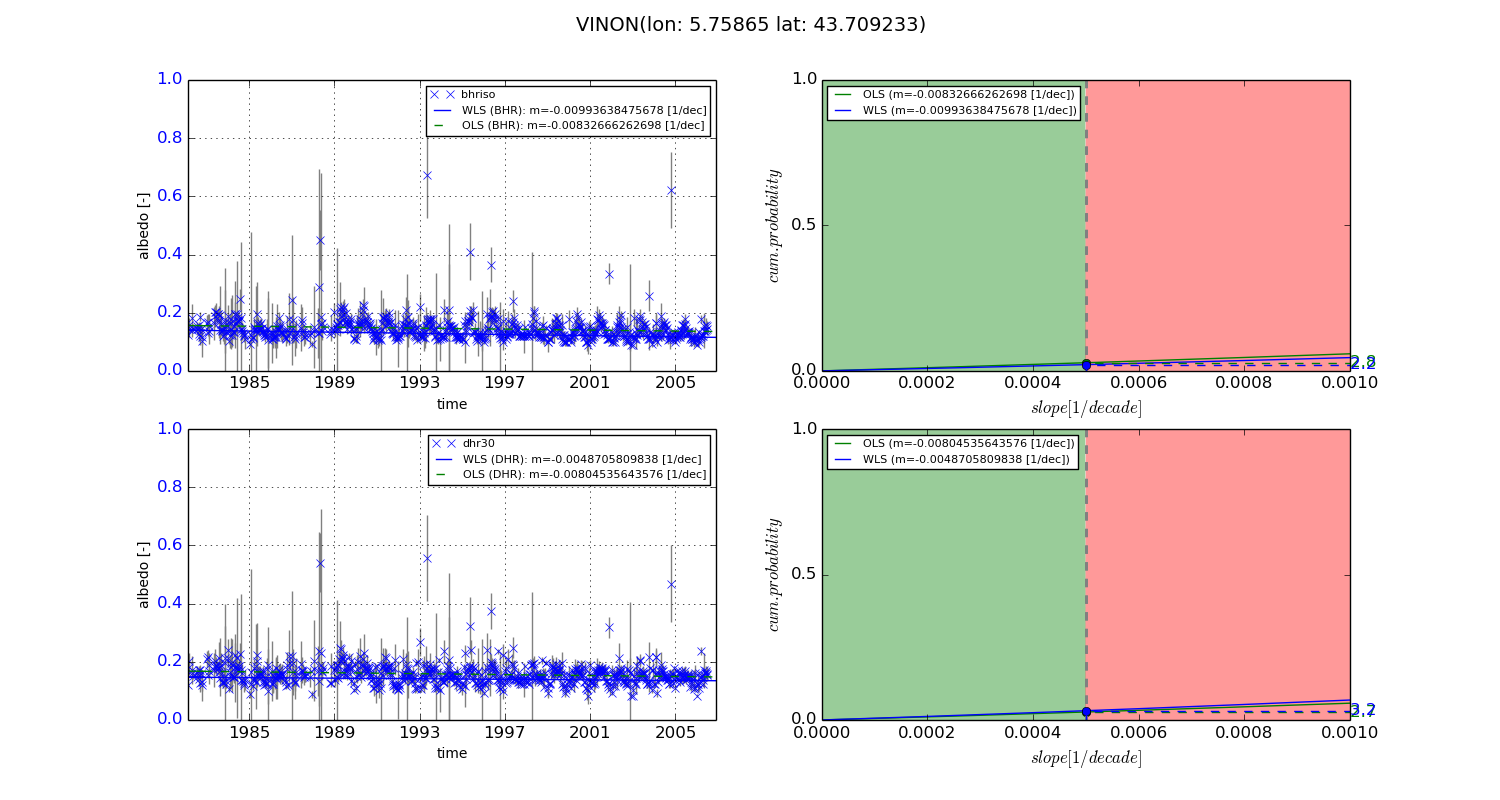
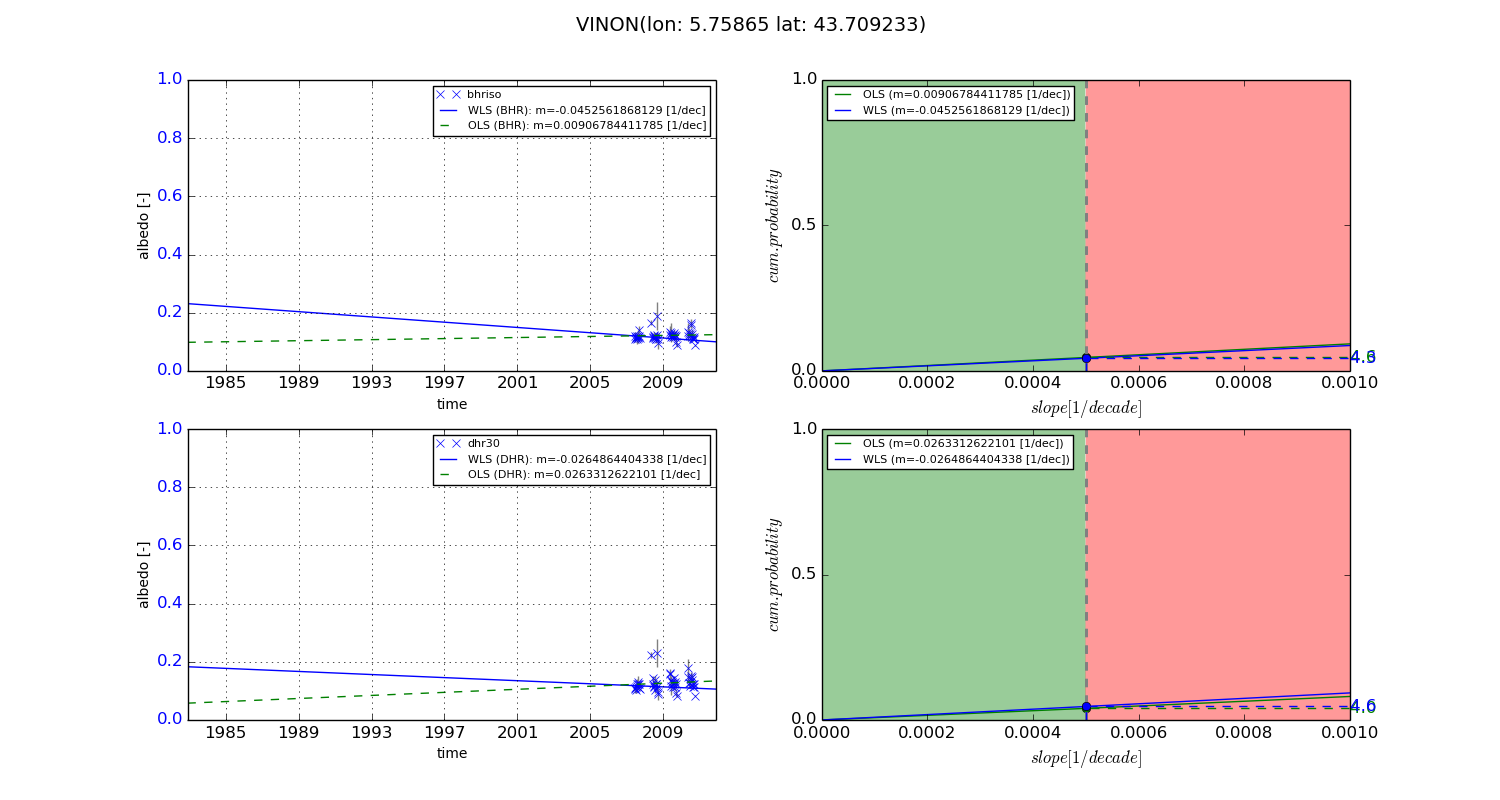
Temporal stability analysis

+000 deg (BHR)


BHR statistics

Temporal stability [1/decade]:


abs

rel


Weighted least square:

-0.00993638475678


Ordinary least square:

-0.00832666262698


Probabilities that GCOS criteria is met:

Weighted least square:

2.2 %

Ordinary least square:

2.8 %


DHR statistics

Temporal stability [1/decade]:


abs

rel


Weighted least square:

-0.0048705809838


Ordinary least square:

-0.00804535643576


Probabilities that GCOS criteria is met:

Weighted least square:

3.2 %

Ordinary least square:

2.7 %


+057/+063 deg (BHR)


BHR statistics

Temporal stability [1/decade]:


abs

rel


Weighted least square:

-0.0452561868129


Ordinary least square:

0.00906784411785


Probabilities that GCOS criteria is met:

Weighted least square:

4.3 %

Ordinary least square:

4.6 %


DHR statistics

Temporal stability [1/decade]:


abs

rel


Weighted least square:

-0.0264864404338


Ordinary least square:

0.0263312622101


Probabilities that GCOS criteria is met:

Weighted least square:

4.6 %

Ordinary least square:

4.0 %


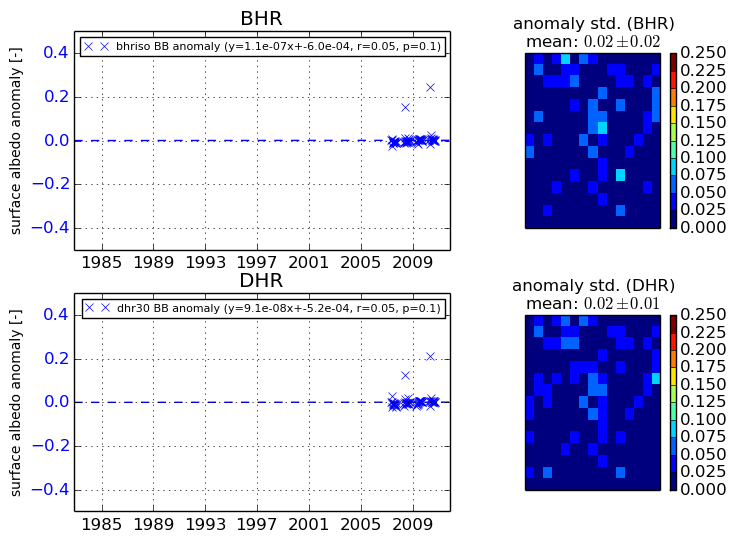
Temporal anomaly analyis

The variance of the temporal anomalies provides an additional measure about the stability of the signal AFTER removal of the mean seasonal cylce.
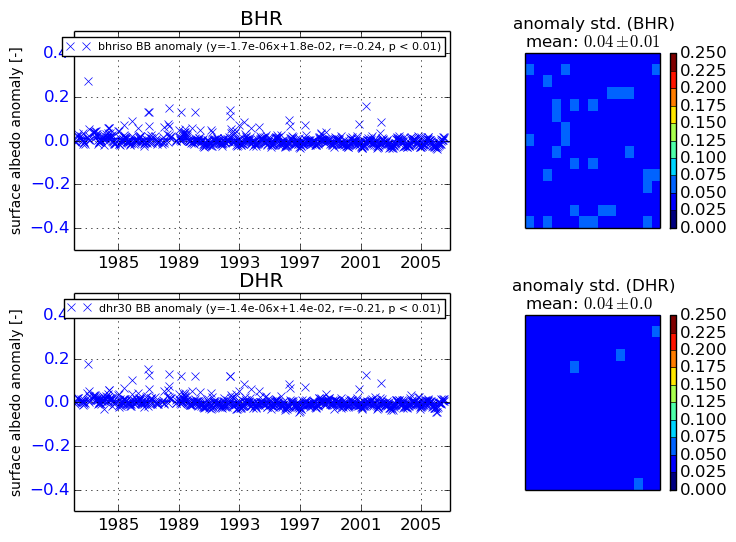
+000 deg


+057/+063 deg