VIRGINIA_COAST_RESERVE_LTER_VCR


Location

lon / lat [deg]: -75.91 / 37.28

Source network: LTER


Geostationary surface albedo (GSA) data


“+000”


“+057/+063”


Landcover information (based on ESA CCI landcover data)


Landcover fractions @ 2km distance


Landcover fractions @ 20 km distance


Legend


Distance to open water bodies [km]:

0.1

Distance to urban areas [km]:

5.78


Radius: 1 km

Number of landcover classes:

1

Dominant landcover type:

210: water bodies

Fraction of dominant landcover type [%]:

100.0


Radius: 2 km

Number of landcover classes:

5

Dominant landcover type:

210: water bodies

Fraction of dominant landcover type [%]:

74.0


Radius: 5 km

Number of landcover classes:

5

Dominant landcover type:

210: water bodies

Fraction of dominant landcover type [%]:

44.0


Radius: 10 km

Number of landcover classes:

5

Dominant landcover type:

210: water bodies

Fraction of dominant landcover type [%]:

48.0


Radius: 20 km

Number of landcover classes:

4

Dominant landcover type:

210: water bodies

Fraction of dominant landcover type [%]:

72.0


Disturbances


Heterogeneity analysis

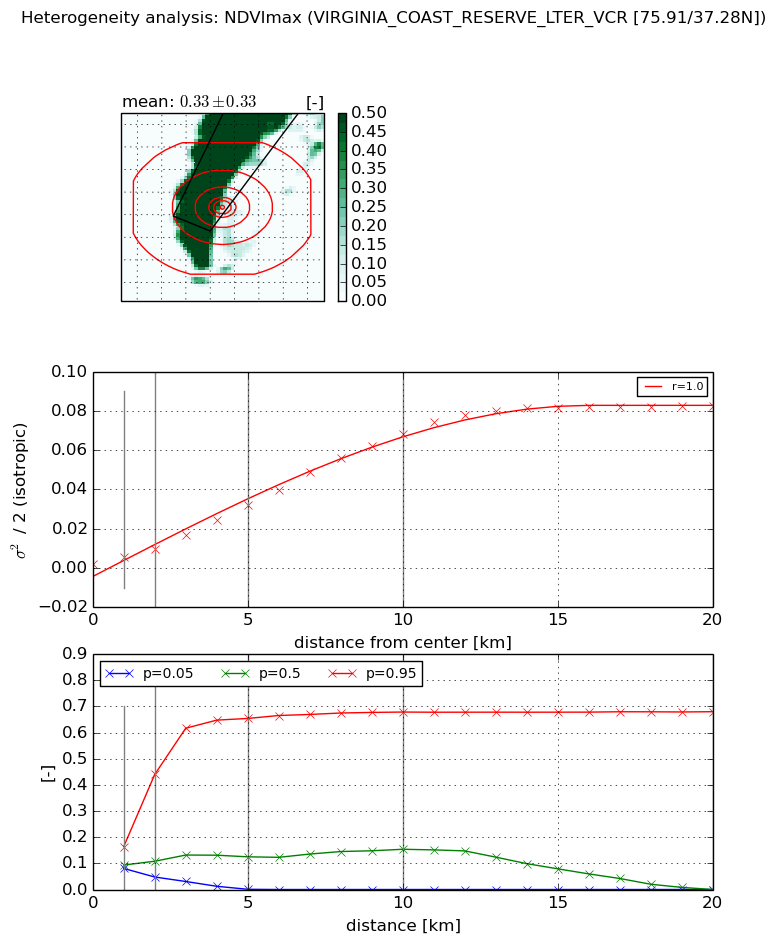
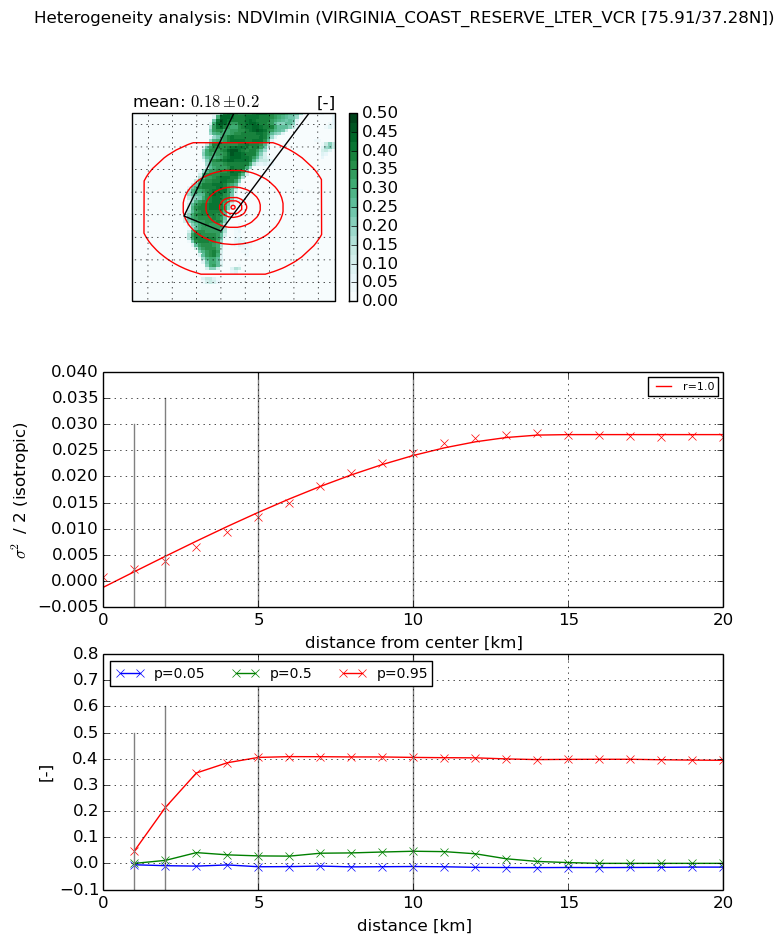
The heterogeneity analysis provides information about the spatial and temporal heterogeneity of the site.

Topography


Roman et al. (2009) index


St

1.41321821081

Rcv

-0.1333624288

Rse

0.0

Rst

-0.366794871305

Rsv

1.62265712236


Height range @ 1km [m]

-99999

Height range @ 2km [m]

-99999

Height range @ 5km [m]

-99999

Height range @ 10km [m]

-99999

Height range @ 20km [m]

-99999


Variance slope @ 1 km

8

Variance slope @ 2 km

4

Variance slope @ 5 km

1

Variance slope @ 10 km

-999

Variance slope @ 20 km

-999


NDVI (max. NDVI composite)


Roman et al. (2009) index


St

1.05408059937e-07

Rcv

0.0847607856893

Rse

0.0

Rst

0.202841356421

Rsv

28460821.4161


NDVI range @ 1km [-]

0.08

NDVI range @ 2km [-]

0.39

NDVI range @ 5km [-]

0.65

NDVI range @ 10km [-]

0.68

NDVI range @ 20km [-]

0.68


Variance slope @ 1 km

0.00355344477345

Variance slope @ 2 km

0.00379682601559

Variance slope @ 5 km

0.00620184944174

Variance slope @ 10 km

0.00707870158873

Variance slope @ 20 km

0.00447855823685


NDVI (min. NDVI composite)I


Roman et al. (2009) index


St

5.72971362107e-06

Rcv

-0.0143609854065

Rse

0.0

Rst

0.162991015842

Rsv

523586.200328


NDVI range @ 1km [-]

0.05

NDVI range @ 2km [-]

0.22

NDVI range @ 5km [-]

0.42

NDVI range @ 10km [-]

0.42

NDVI range @ 20km [-]

0.41


NDVI slope @ 1 km

0.00139387762252

NDVI slope @ 2 km

0.00146487954238

NDVI slope @ 5 km

0.00233026456781

NDVI slope @ 10 km

0.00253756103071

NDVI slope @ 20 km

0.00145816900418


Temporal stability analysis

+000 deg (BHR)


BHR statistics

Temporal stability [1/decade]:


abs

rel


Weighted least square:

-99999.0


Ordinary least square:

-99999.0


Probabilities that GCOS criteria is met:

Weighted least square:

-99999.0 %

Ordinary least square:

-99999.0 %


DHR statistics

Temporal stability [1/decade]:


abs

rel


Weighted least square:

-99999.0


Ordinary least square:

-99999.0


Probabilities that GCOS criteria is met:

Weighted least square:

-99999.0 %

Ordinary least square:

-99999.0 %


+057/+063 deg (BHR)


BHR statistics

Temporal stability [1/decade]:


abs

rel


Weighted least square:

None


Ordinary least square:

None


Probabilities that GCOS criteria is met:

Weighted least square:

None %

Ordinary least square:

None %


DHR statistics

Temporal stability [1/decade]:


abs

rel


Weighted least square:

None


Ordinary least square:

None


Probabilities that GCOS criteria is met:

Weighted least square:

None %

Ordinary least square:

None %


Temporal anomaly analyis

The variance of the temporal anomalies provides an additional measure about the stability of the signal AFTER removal of the mean seasonal cylce.

+000 deg


+057/+063 deg