WSTF


Location

lon / lat [deg]: -106.6089 / 32.5064

Source network: AERONET


Geostationary surface albedo (GSA) data


“+000”


“+057/+063”


Landcover information (based on ESA CCI landcover data)


Landcover fractions @ 2km distance


Landcover fractions @ 20 km distance


Legend


Distance to open water bodies [km]:

26.16

Distance to urban areas [km]:

0.1


Radius: 1 km

Number of landcover classes:

2

Dominant landcover type:

120: Shrubland

Fraction of dominant landcover type [%]:

78.0


Radius: 2 km

Number of landcover classes:

2

Dominant landcover type:

120: Shrubland

Fraction of dominant landcover type [%]:

94.0


Radius: 5 km

Number of landcover classes:

3

Dominant landcover type:

120: Shrubland

Fraction of dominant landcover type [%]:

95.0


Radius: 10 km

Number of landcover classes:

2

Dominant landcover type:

120: Shrubland

Fraction of dominant landcover type [%]:

88.0


Radius: 20 km

Number of landcover classes:

4

Dominant landcover type:

120: Shrubland

Fraction of dominant landcover type [%]:

89.0


Disturbances


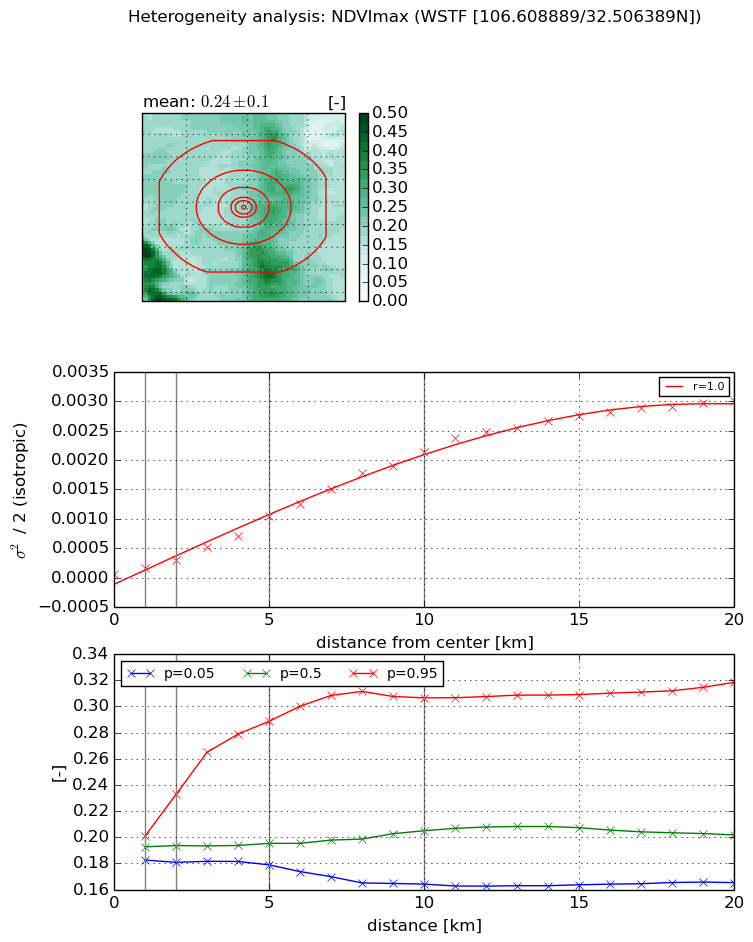
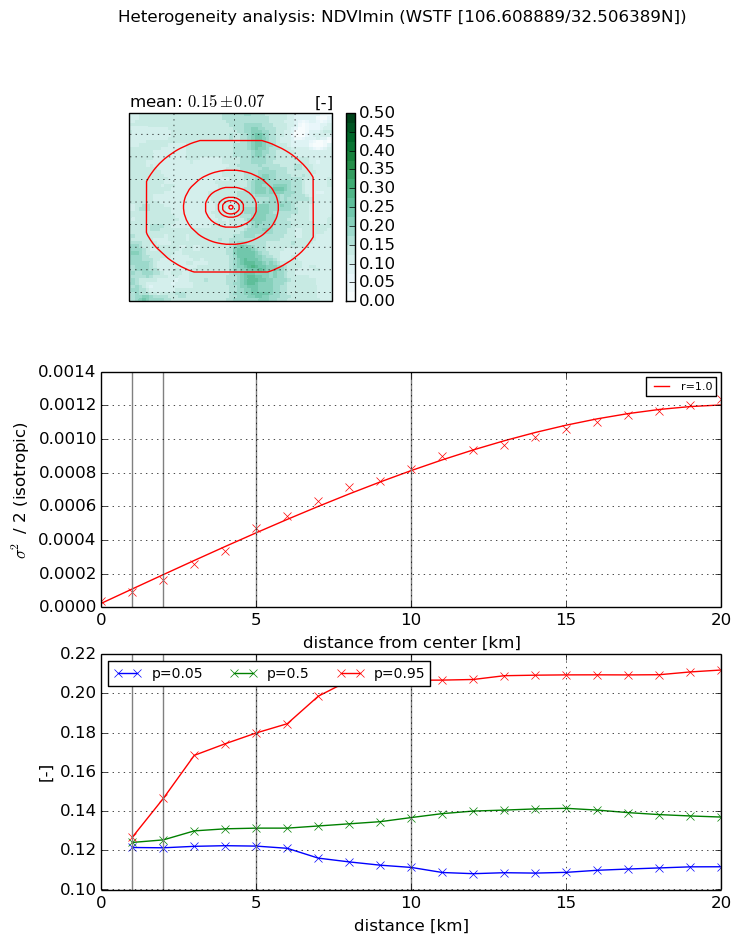
Heterogeneity analysis

The heterogeneity analysis provides information about the spatial and temporal heterogeneity of the site.

Topography


Roman et al. (2009) index


St

3.19270840538

Rcv

0.734607045814

Rse

0.0

Rst

-5.5279321267e-07

Rsv

-0.205033489486


Height range @ 1km [m]

43

Height range @ 2km [m]

93

Height range @ 5km [m]

419

Height range @ 10km [m]

-999

Height range @ 20km [m]

-999


Variance slope @ 1 km

2628

Variance slope @ 2 km

2940

Variance slope @ 5 km

3413

Variance slope @ 10 km

-999

Variance slope @ 20 km

-999


NDVI (max. NDVI composite)


Roman et al. (2009) index


St

2.19258740046

Rcv

0.369038303495

Rse

0.0

Rst

-1.11492697296e-07

Rsv

-0.999208068311


NDVI range @ 1km [-]

0.02

NDVI range @ 2km [-]

0.05

NDVI range @ 5km [-]

0.11

NDVI range @ 10km [-]

0.14

NDVI range @ 20km [-]

0.15


Variance slope @ 1 km

0.000105725358561

Variance slope @ 2 km

0.000117511933356

Variance slope @ 5 km

0.000192468359142

Variance slope @ 10 km

0.000220644879436

Variance slope @ 20 km

0.000160742786222


NDVI (min. NDVI composite)I


Roman et al. (2009) index


St

2.02382171522

Rcv

0.268105302757

Rse

0.0

Rst

-0.214238985675

Rsv

-0.999999723117


NDVI range @ 1km [-]

0.01

NDVI range @ 2km [-]

0.03

NDVI range @ 5km [-]

0.06

NDVI range @ 10km [-]

0.1

NDVI range @ 20km [-]

0.1


NDVI slope @ 1 km

5.60040402771e-05

NDVI slope @ 2 km

6.10989664119e-05

NDVI slope @ 5 km

8.53584454721e-05

NDVI slope @ 10 km

8.33690063611e-05

NDVI slope @ 20 km

6.13028560952e-05


Temporal stability analysis

+000 deg (BHR)


BHR statistics

Temporal stability [1/decade]:


abs

rel


Weighted least square:

None


Ordinary least square:

None


Probabilities that GCOS criteria is met:

Weighted least square:

None %

Ordinary least square:

None %


DHR statistics

Temporal stability [1/decade]:


abs

rel


Weighted least square:

None


Ordinary least square:

None


Probabilities that GCOS criteria is met:

Weighted least square:

None %

Ordinary least square:

None %


+057/+063 deg (BHR)


BHR statistics

Temporal stability [1/decade]:


abs

rel


Weighted least square:

None


Ordinary least square:

None


Probabilities that GCOS criteria is met:

Weighted least square:

None %

Ordinary least square:

None %


DHR statistics

Temporal stability [1/decade]:


abs

rel


Weighted least square:

None


Ordinary least square:

None


Probabilities that GCOS criteria is met:

Weighted least square:

None %

Ordinary least square:

None %


Temporal anomaly analyis

The variance of the temporal anomalies provides an additional measure about the stability of the signal AFTER removal of the mean seasonal cylce.

+000 deg


+057/+063 deg