WUHAN_CITY


Location

lon / lat [deg]: 114.3546 / 30.5283

Source network: AERONET


Geostationary surface albedo (GSA) data


“+000”


“+057/+063”


Landcover information (based on ESA CCI landcover data)


Landcover fractions @ 2km distance


Landcover fractions @ 20 km distance


Legend


Distance to open water bodies [km]:

1.39

Distance to urban areas [km]:

0.11


Radius: 1 km

Number of landcover classes:

1

Dominant landcover type:

190: urban areas

Fraction of dominant landcover type [%]:

100.0


Radius: 2 km

Number of landcover classes:

2

Dominant landcover type:

190: urban areas

Fraction of dominant landcover type [%]:

96.0


Radius: 5 km

Number of landcover classes:

3

Dominant landcover type:

190: urban areas

Fraction of dominant landcover type [%]:

61.0


Radius: 10 km

Number of landcover classes:

5

Dominant landcover type:

190: urban areas

Fraction of dominant landcover type [%]:

44.0


Radius: 20 km

Number of landcover classes:

6

Dominant landcover type:

210: water bodies

Fraction of dominant landcover type [%]:

43.0


Disturbances


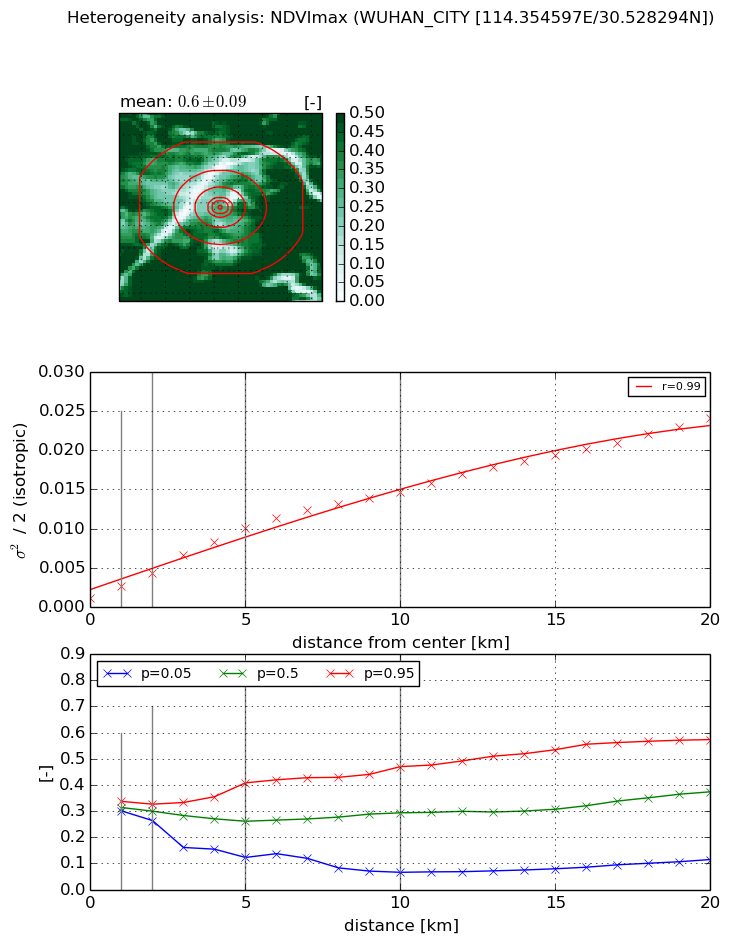
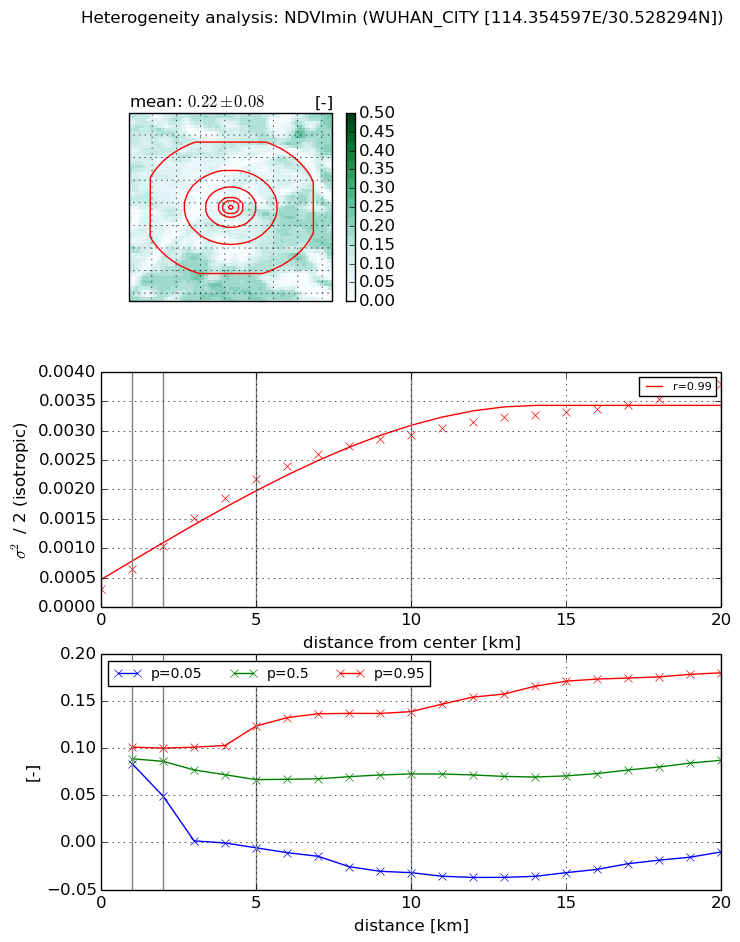
Heterogeneity analysis

The heterogeneity analysis provides information about the spatial and temporal heterogeneity of the site.

Topography


Roman et al. (2009) index


St

1.24083796892

Rcv

-0.0324438949077

Rse

0.0

Rst

-0.292069162068

Rsv

2.09320793088


Height range @ 1km [m]

28

Height range @ 2km [m]

37

Height range @ 5km [m]

27

Height range @ 10km [m]

-999

Height range @ 20km [m]

-999


Variance slope @ 1 km

77

Variance slope @ 2 km

42

Variance slope @ 5 km

21

Variance slope @ 10 km

-999

Variance slope @ 20 km

-999


NDVI (max. NDVI composite)


Roman et al. (2009) index


St

8.77307222404e-07

Rcv

0.43221920407

Rse

0.0

Rst

-0.0684771453893

Rsv

3419554.15859


NDVI range @ 1km [-]

0.04

NDVI range @ 2km [-]

0.06

NDVI range @ 5km [-]

0.29

NDVI range @ 10km [-]

0.4

NDVI range @ 20km [-]

0.46


Variance slope @ 1 km

0.00146497945993

Variance slope @ 2 km

0.00161310562578

Variance slope @ 5 km

0.00182857946431

Variance slope @ 10 km

0.00139144999876

Variance slope @ 20 km

0.00107233463365


NDVI (min. NDVI composite)I


Roman et al. (2009) index


St

4.14267485933

Rcv

0.33321112813

Rse

0.0

Rst

0.21485914731

Rsv

-0.176099518683


NDVI range @ 1km [-]

0.02

NDVI range @ 2km [-]

0.05

NDVI range @ 5km [-]

0.13

NDVI range @ 10km [-]

0.17

NDVI range @ 20km [-]

0.19


NDVI slope @ 1 km

0.000336198154711

NDVI slope @ 2 km

0.000364476974748

NDVI slope @ 5 km

0.00038288748017

NDVI slope @ 10 km

0.000269933903116

NDVI slope @ 20 km

0.000151281056544


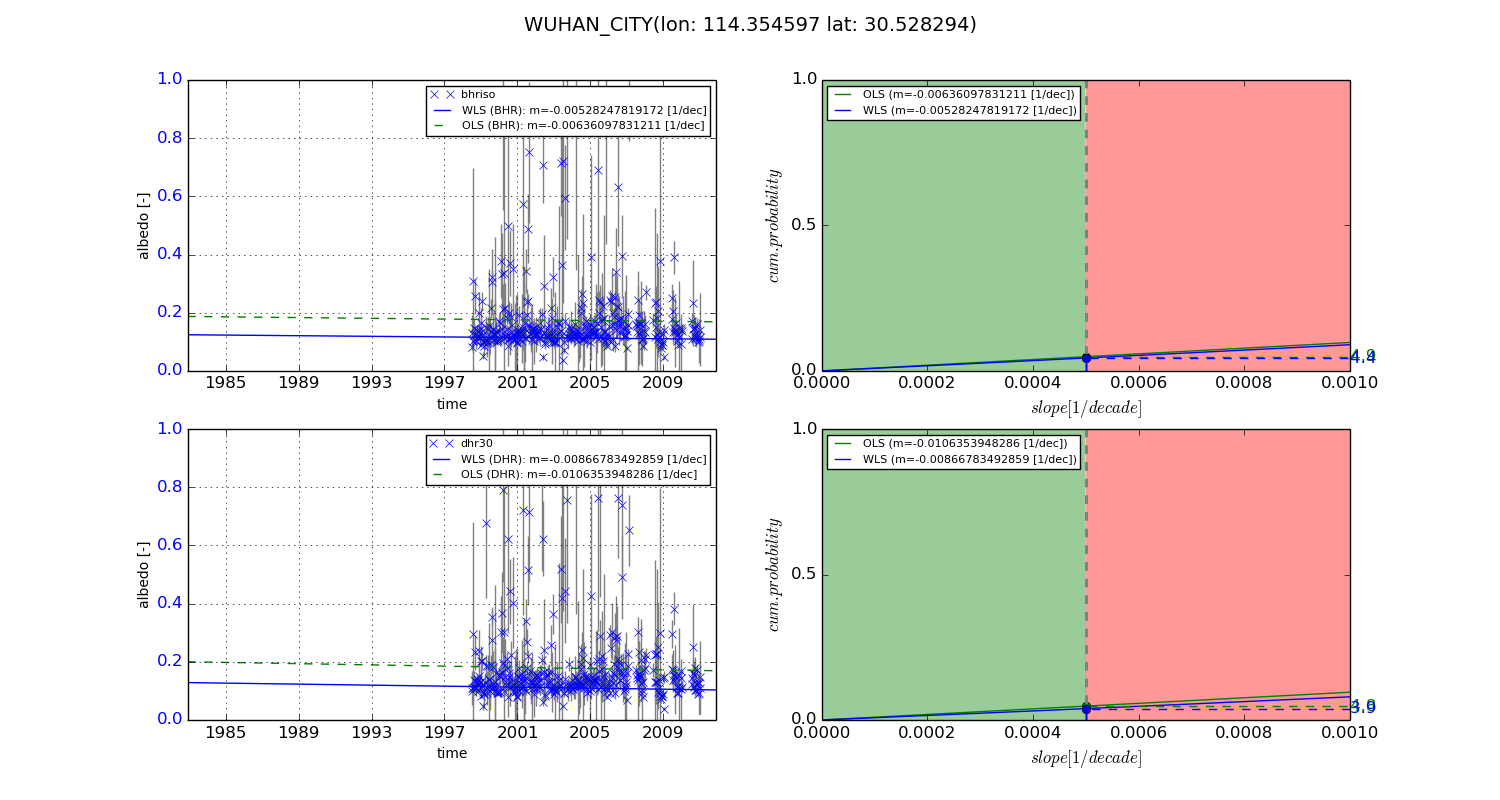
Temporal stability analysis

+000 deg (BHR)


BHR statistics

Temporal stability [1/decade]:


abs

rel


Weighted least square:

None


Ordinary least square:

None


Probabilities that GCOS criteria is met:

Weighted least square:

None %

Ordinary least square:

None %


DHR statistics

Temporal stability [1/decade]:


abs

rel


Weighted least square:

None


Ordinary least square:

None


Probabilities that GCOS criteria is met:

Weighted least square:

None %

Ordinary least square:

None %


+057/+063 deg (BHR)


BHR statistics

Temporal stability [1/decade]:


abs

rel


Weighted least square:

-0.00528247819172


Ordinary least square:

-0.00636097831211


Probabilities that GCOS criteria is met:

Weighted least square:

4.4 %

Ordinary least square:

4.9 %


DHR statistics

Temporal stability [1/decade]:


abs

rel


Weighted least square:

-0.00866783492859


Ordinary least square:

-0.0106353948286


Probabilities that GCOS criteria is met:

Weighted least square:

3.9 %

Ordinary least square:

4.8 %


Temporal anomaly analyis

The variance of the temporal anomalies provides an additional measure about the stability of the signal AFTER removal of the mean seasonal cylce.

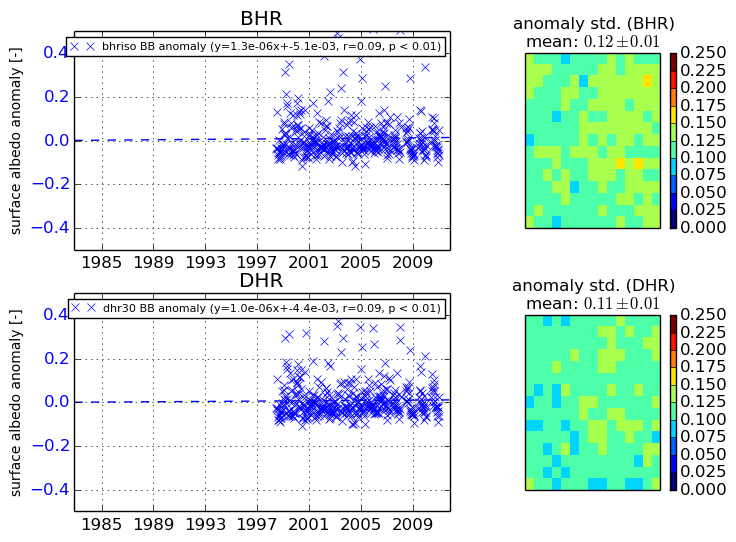
+000 deg


+057/+063 deg