XIA


Location

lon / lat [deg]: 116.962 / 39.754

Source network: BSRN


Geostationary surface albedo (GSA) data


“+000”


“+057/+063”


Landcover information (based on ESA CCI landcover data)


Landcover fractions @ 2km distance


Landcover fractions @ 20 km distance


Legend


Distance to open water bodies [km]:

2.9

Distance to urban areas [km]:

0.67


Radius: 1 km

Number of landcover classes:

4

Dominant landcover type:

10: cropland, rainfed

Fraction of dominant landcover type [%]:

56.0


Radius: 2 km

Number of landcover classes:

5

Dominant landcover type:

10: cropland, rainfed

Fraction of dominant landcover type [%]:

61.0


Radius: 5 km

Number of landcover classes:

6

Dominant landcover type:

10: cropland, rainfed

Fraction of dominant landcover type [%]:

62.0


Radius: 10 km

Number of landcover classes:

5

Dominant landcover type:

10: cropland, rainfed

Fraction of dominant landcover type [%]:

71.0


Radius: 20 km

Number of landcover classes:

5

Dominant landcover type:

10: cropland, rainfed

Fraction of dominant landcover type [%]:

75.0


Disturbances


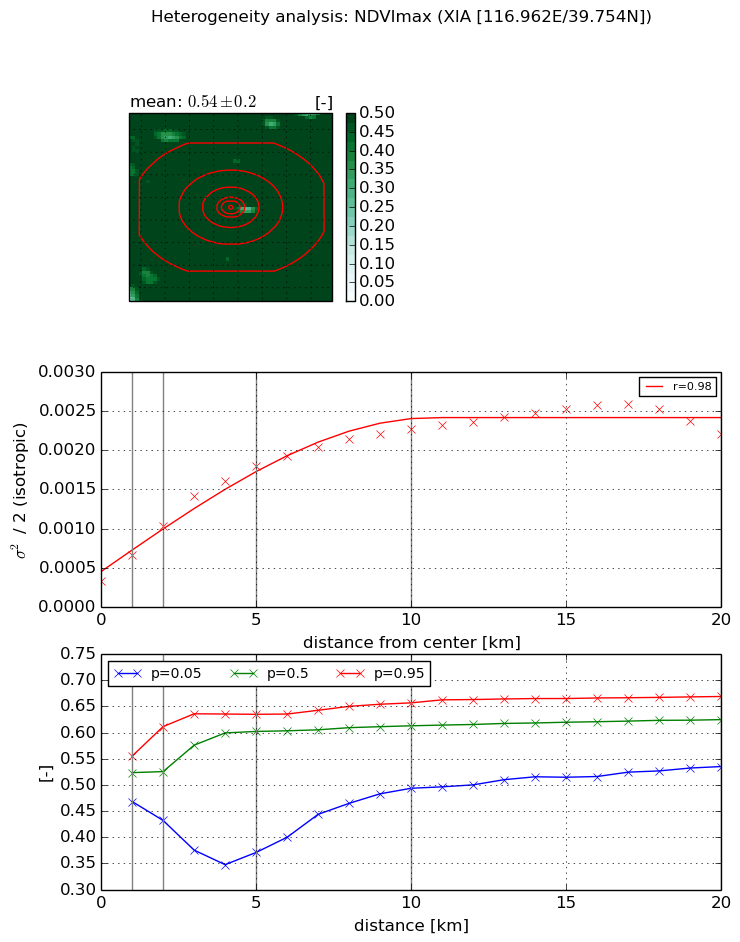
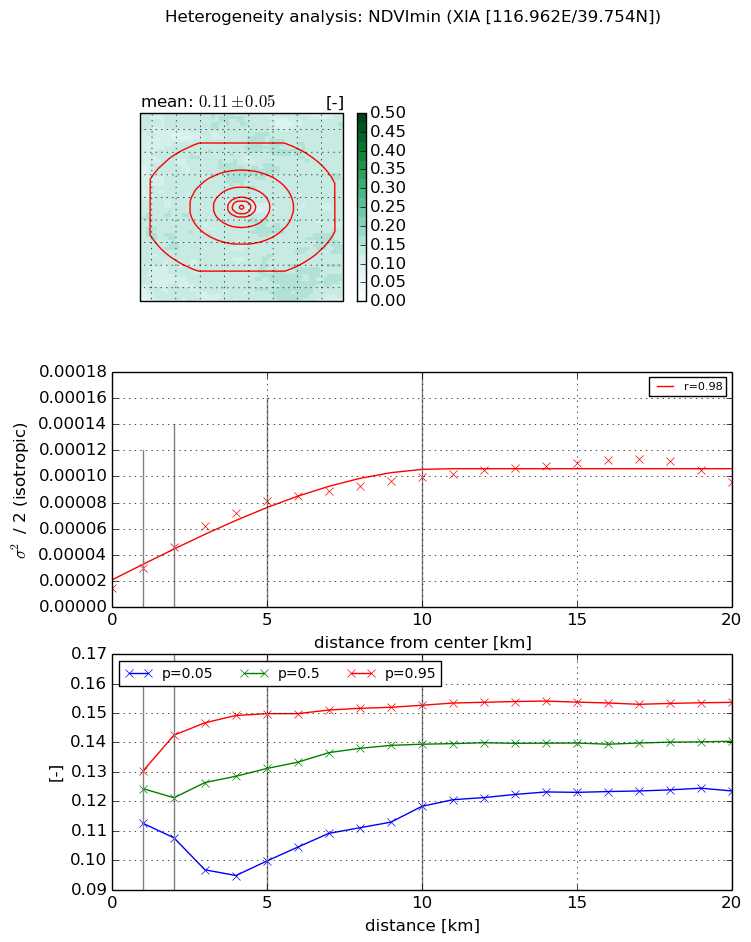
Heterogeneity analysis

The heterogeneity analysis provides information about the spatial and temporal heterogeneity of the site.

Topography


Roman et al. (2009) index


St

3.72315801024

Rcv

0.109208533656

Rse

0.0

Rst

1.5400164708e-06

Rsv

-0.696557500991


Height range @ 1km [m]

7

Height range @ 2km [m]

6

Height range @ 5km [m]

8

Height range @ 10km [m]

-999

Height range @ 20km [m]

-999


Variance slope @ 1 km

2

Variance slope @ 2 km

1

Variance slope @ 5 km

0

Variance slope @ 10 km

-999

Variance slope @ 20 km

-999


NDVI (max. NDVI composite)


Roman et al. (2009) index


St

7.87602145555

Rcv

-0.109189195305

Rse

0.0

Rst

0.206995211096

Rsv

-0.0647185681439


NDVI range @ 1km [-]

0.09

NDVI range @ 2km [-]

0.18

NDVI range @ 5km [-]

0.26

NDVI range @ 10km [-]

0.16

NDVI range @ 20km [-]

0.13


Variance slope @ 1 km

0.000328750949127

Variance slope @ 2 km

0.000346560919883

Variance slope @ 5 km

0.000301662707439

Variance slope @ 10 km

0.000188969214625

Variance slope @ 20 km

8.78268234379e-05


NDVI (min. NDVI composite)I


Roman et al. (2009) index


St

8.36247768225

Rcv

-0.115276752941

Rse

0.0

Rst

0.0518973033763

Rsv

-0.191571295717


NDVI range @ 1km [-]

0.02

NDVI range @ 2km [-]

0.03

NDVI range @ 5km [-]

0.05

NDVI range @ 10km [-]

0.03

NDVI range @ 20km [-]

0.03


NDVI slope @ 1 km

1.49682430812e-05

NDVI slope @ 2 km

1.55338520475e-05

NDVI slope @ 5 km

1.34920915697e-05

NDVI slope @ 10 km

8.13700021128e-06

NDVI slope @ 20 km

3.79982469821e-06


Temporal stability analysis

+000 deg (BHR)


BHR statistics

Temporal stability [1/decade]:


abs

rel


Weighted least square:

None


Ordinary least square:

None


Probabilities that GCOS criteria is met:

Weighted least square:

None %

Ordinary least square:

None %


DHR statistics

Temporal stability [1/decade]:


abs

rel


Weighted least square:

None


Ordinary least square:

None


Probabilities that GCOS criteria is met:

Weighted least square:

None %

Ordinary least square:

None %


+057/+063 deg (BHR)


BHR statistics

Temporal stability [1/decade]:


abs

rel


Weighted least square:

-99999.0


Ordinary least square:

-99999.0


Probabilities that GCOS criteria is met:

Weighted least square:

-99999.0 %

Ordinary least square:

-99999.0 %


DHR statistics

Temporal stability [1/decade]:


abs

rel


Weighted least square:

-99999.0


Ordinary least square:

-99999.0


Probabilities that GCOS criteria is met:

Weighted least square:

-99999.0 %

Ordinary least square:

-99999.0 %


Temporal anomaly analyis

The variance of the temporal anomalies provides an additional measure about the stability of the signal AFTER removal of the mean seasonal cylce.

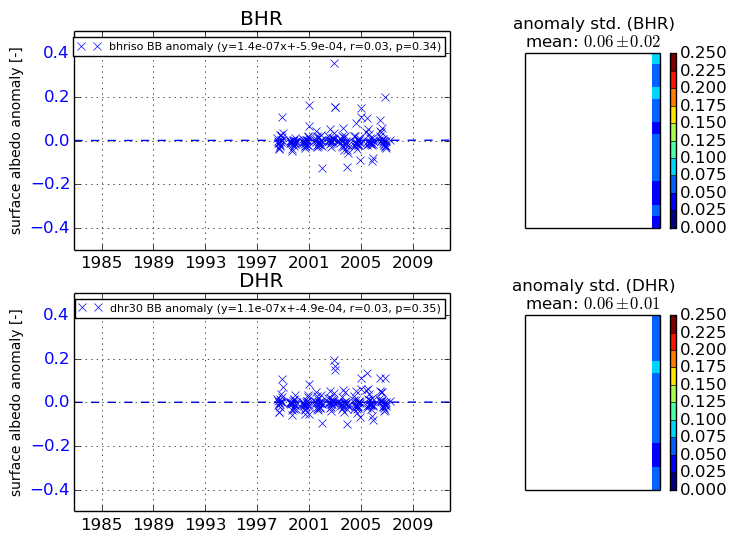
+000 deg


+057/+063 deg