XINZHENG


Location

lon / lat [deg]: 113.717 / 34.383

Source network: AERONET


Geostationary surface albedo (GSA) data


“+000”


“+057/+063”


Landcover information (based on ESA CCI landcover data)


Landcover fractions @ 2km distance


Landcover fractions @ 20 km distance


Legend


Distance to open water bodies [km]:

0.82

Distance to urban areas [km]:

1.01


Radius: 1 km

Number of landcover classes:

5

Dominant landcover type:

10: cropland, rainfed

Fraction of dominant landcover type [%]:

68.0


Radius: 2 km

Number of landcover classes:

6

Dominant landcover type:

10: cropland, rainfed

Fraction of dominant landcover type [%]:

38.0


Radius: 5 km

Number of landcover classes:

6

Dominant landcover type:

20: cropland, irrigated or post-flooded

Fraction of dominant landcover type [%]:

43.0


Radius: 10 km

Number of landcover classes:

5

Dominant landcover type:

20: cropland, irrigated or post-flooded

Fraction of dominant landcover type [%]:

61.0


Radius: 20 km

Number of landcover classes:

5

Dominant landcover type:

20: cropland, irrigated or post-flooded

Fraction of dominant landcover type [%]:

61.0


Disturbances


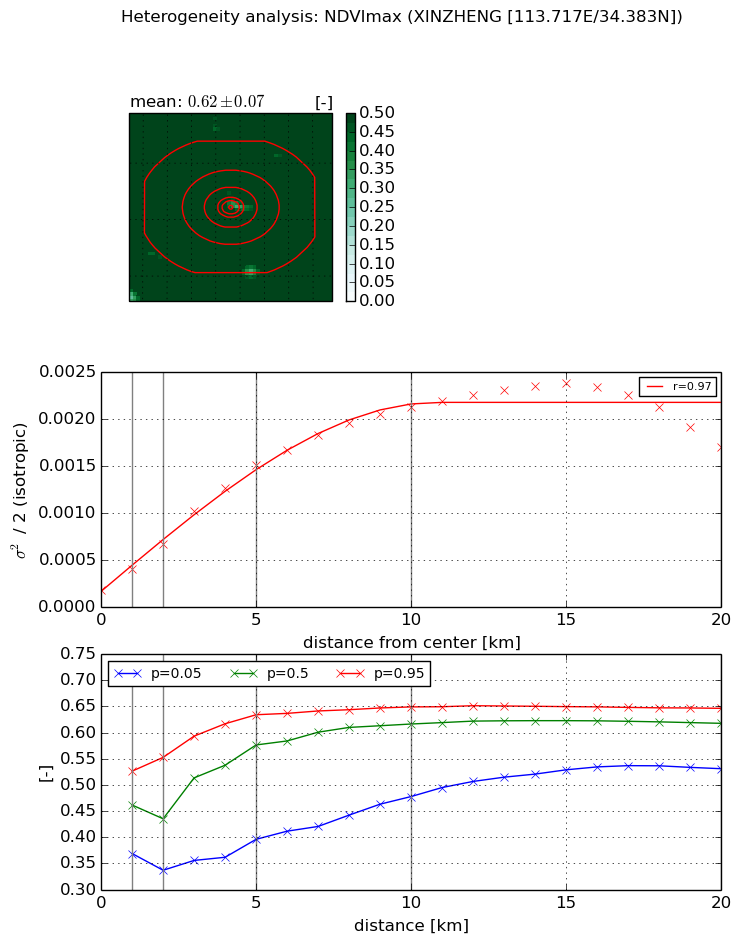
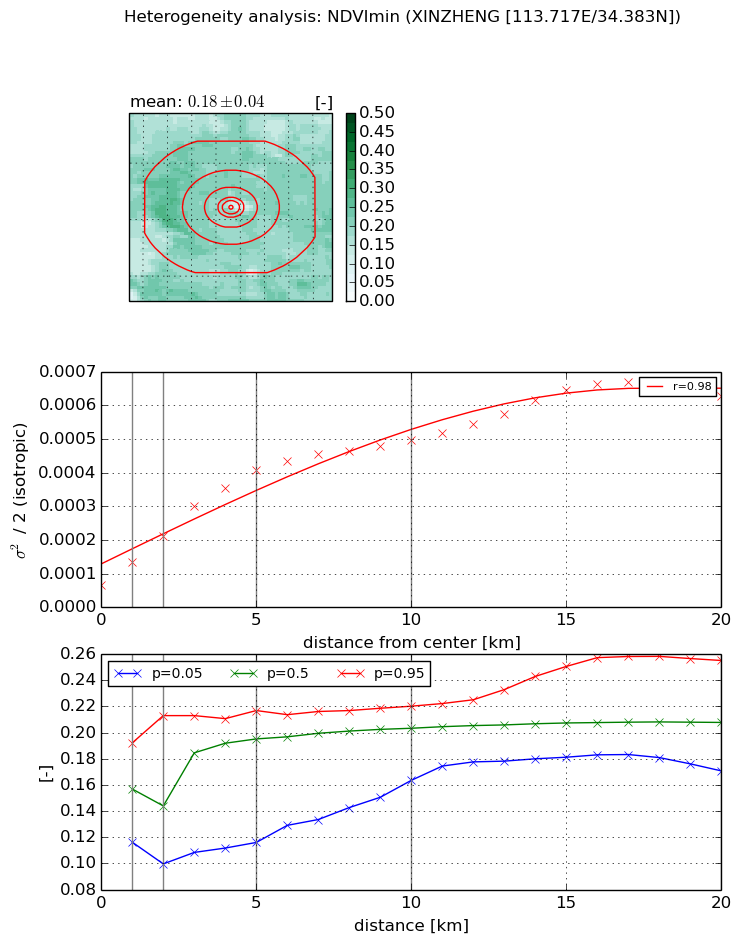
Heterogeneity analysis

The heterogeneity analysis provides information about the spatial and temporal heterogeneity of the site.

Topography


Roman et al. (2009) index


St

1.56594437396

Rcv

0.309268951353

Rse

0.0

Rst

-0.124432144106

Rsv

1.4820757673


Height range @ 1km [m]

19

Height range @ 2km [m]

19

Height range @ 5km [m]

23

Height range @ 10km [m]

-999

Height range @ 20km [m]

-999


Variance slope @ 1 km

18

Variance slope @ 2 km

14

Variance slope @ 5 km

12

Variance slope @ 10 km

-999

Variance slope @ 20 km

-999


NDVI (max. NDVI composite)


Roman et al. (2009) index


St

9.68491529272

Rcv

-0.129145213504

Rse

0.0

Rst

0.0427614293686

Rsv

0.137853423099


NDVI range @ 1km [-]

0.16

NDVI range @ 2km [-]

0.22

NDVI range @ 5km [-]

0.24

NDVI range @ 10km [-]

0.17

NDVI range @ 20km [-]

0.12


Variance slope @ 1 km

0.000215038160599

Variance slope @ 2 km

0.000241868649576

Variance slope @ 5 km

0.000274210771273

Variance slope @ 10 km

0.000201611765678

Variance slope @ 20 km

8.39601938324e-05


NDVI (min. NDVI composite)I


Roman et al. (2009) index


St

9.77845690746

Rcv

-0.260950328033

Rse

0.0

Rst

0.0157434715631

Rsv

0.0301030732026


NDVI range @ 1km [-]

0.08

NDVI range @ 2km [-]

0.11

NDVI range @ 5km [-]

0.1

NDVI range @ 10km [-]

0.06

NDVI range @ 20km [-]

0.08


NDVI slope @ 1 km

6.77464791902e-05

NDVI slope @ 2 km

7.2588504184e-05

NDVI slope @ 5 km

7.02771622073e-05

NDVI slope @ 10 km

4.26339296658e-05

NDVI slope @ 20 km

2.71892479163e-05


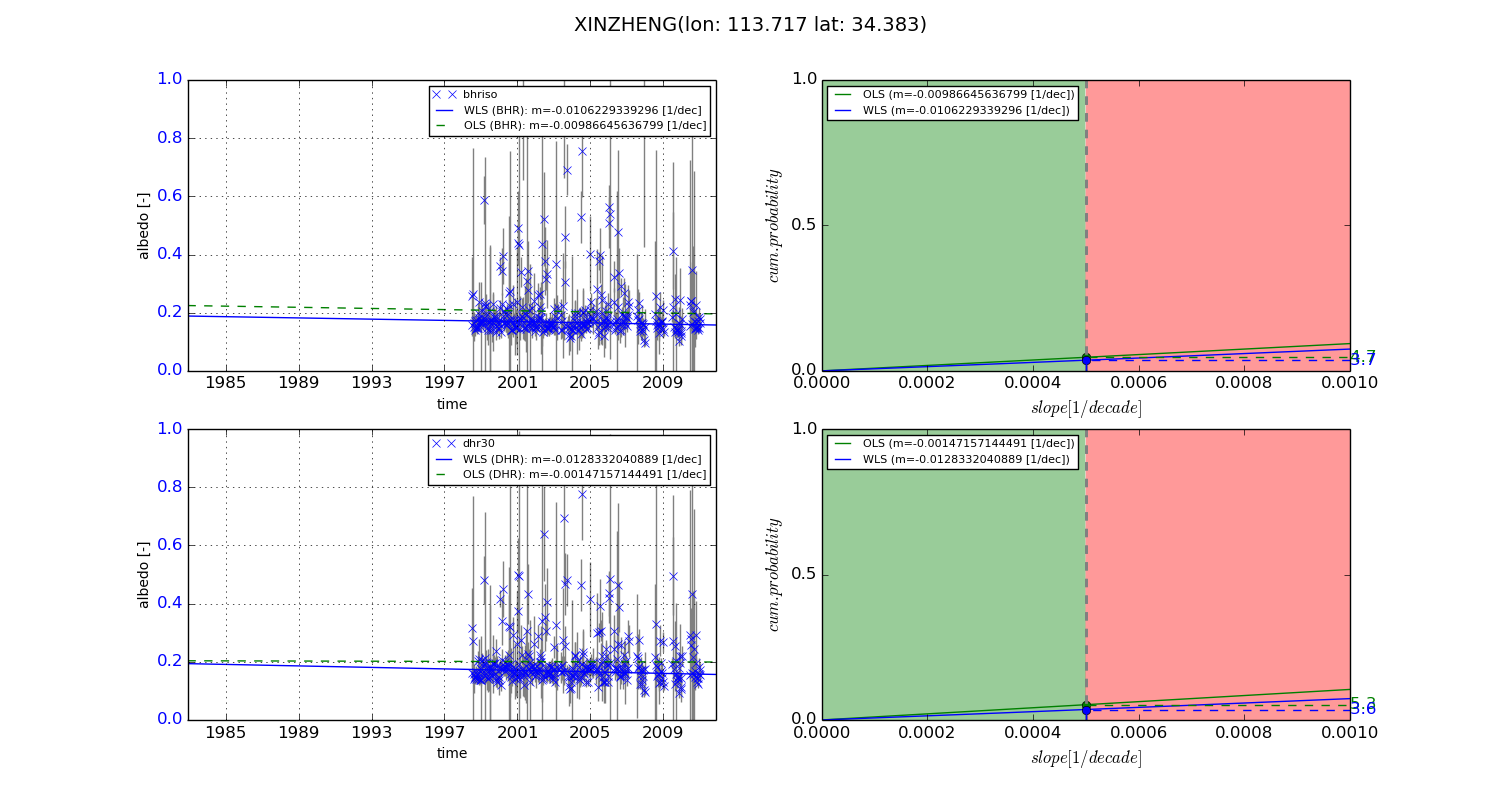
Temporal stability analysis

+000 deg (BHR)


BHR statistics

Temporal stability [1/decade]:


abs

rel


Weighted least square:

None


Ordinary least square:

None


Probabilities that GCOS criteria is met:

Weighted least square:

None %

Ordinary least square:

None %


DHR statistics

Temporal stability [1/decade]:


abs

rel


Weighted least square:

None


Ordinary least square:

None


Probabilities that GCOS criteria is met:

Weighted least square:

None %

Ordinary least square:

None %


+057/+063 deg (BHR)


BHR statistics

Temporal stability [1/decade]:


abs

rel


Weighted least square:

-0.0106229339296


Ordinary least square:

-0.00986645636799


Probabilities that GCOS criteria is met:

Weighted least square:

3.7 %

Ordinary least square:

4.7 %


DHR statistics

Temporal stability [1/decade]:


abs

rel


Weighted least square:

-0.0128332040889


Ordinary least square:

-0.00147157144491


Probabilities that GCOS criteria is met:

Weighted least square:

3.6 %

Ordinary least square:

5.3 %


Temporal anomaly analyis

The variance of the temporal anomalies provides an additional measure about the stability of the signal AFTER removal of the mean seasonal cylce.

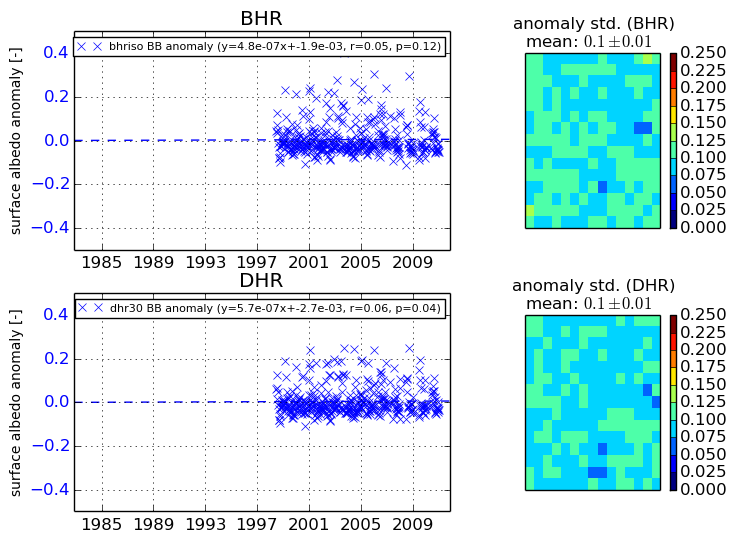
+000 deg


+057/+063 deg