XUZHOU


Location

lon / lat [deg]: 117.1417 / 34.2167

Source network: AERONET


Geostationary surface albedo (GSA) data


“+000”


“+057/+063”


Landcover information (based on ESA CCI landcover data)


Landcover fractions @ 2km distance


Landcover fractions @ 20 km distance


Legend


Distance to open water bodies [km]:

1.53

Distance to urban areas [km]:

1.01


Radius: 1 km

Number of landcover classes:

6

Dominant landcover type:

10: cropland, rainfed

Fraction of dominant landcover type [%]:

39.0


Radius: 2 km

Number of landcover classes:

11

Dominant landcover type:

10: cropland, rainfed

Fraction of dominant landcover type [%]:

34.0


Radius: 5 km

Number of landcover classes:

10

Dominant landcover type:

210: water bodies

Fraction of dominant landcover type [%]:

31.0


Radius: 10 km

Number of landcover classes:

7

Dominant landcover type:

190: urban areas

Fraction of dominant landcover type [%]:

27.0


Radius: 20 km

Number of landcover classes:

8

Dominant landcover type:

20: cropland, irrigated or post-flooded

Fraction of dominant landcover type [%]:

35.0


Disturbances


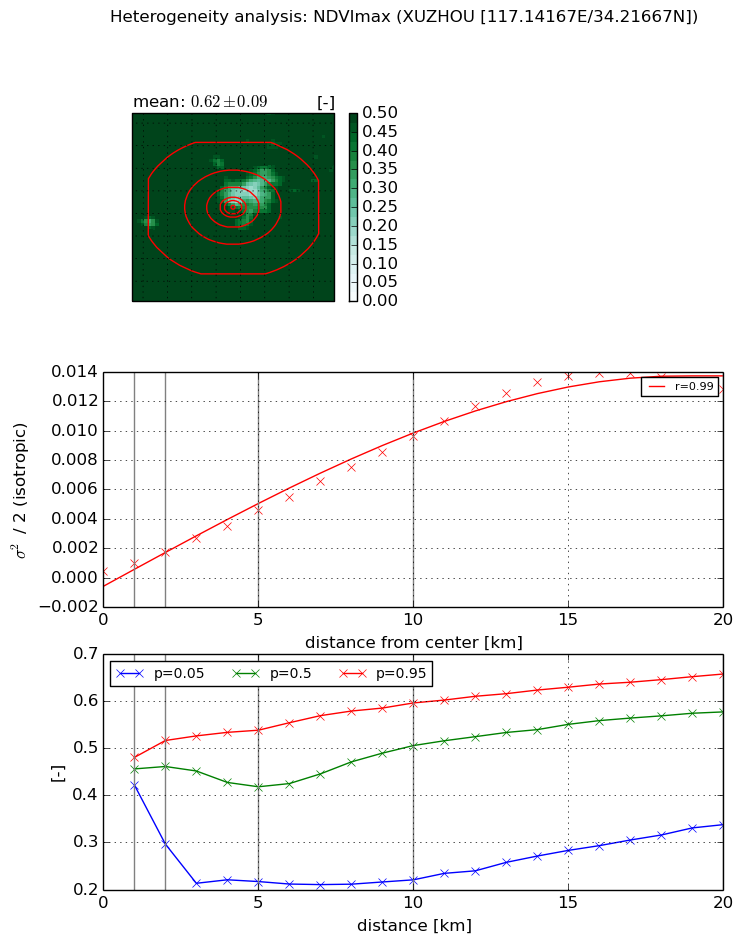
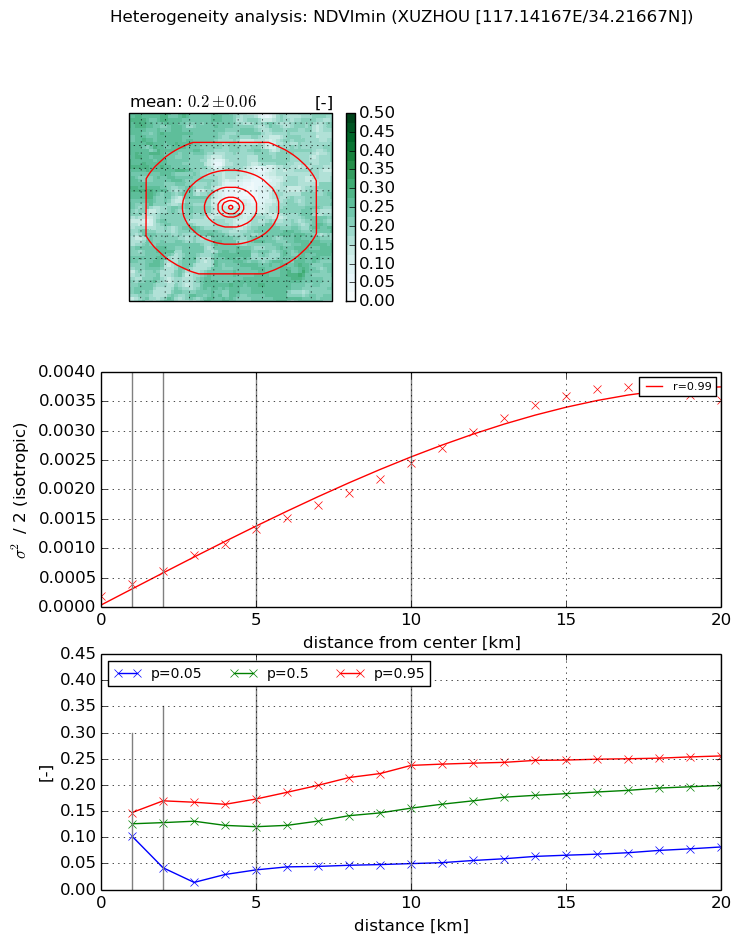
Heterogeneity analysis

The heterogeneity analysis provides information about the spatial and temporal heterogeneity of the site.

Topography


Roman et al. (2009) index


St

10.6663072519

Rcv

-0.0346254276746

Rse

0.0

Rst

-0.0589752109822

Rsv

0.187658838419


Height range @ 1km [m]

42

Height range @ 2km [m]

133

Height range @ 5km [m]

100

Height range @ 10km [m]

-999

Height range @ 20km [m]

-999


Variance slope @ 1 km

608

Variance slope @ 2 km

451

Variance slope @ 5 km

172

Variance slope @ 10 km

-999

Variance slope @ 20 km

-999


NDVI (max. NDVI composite)


Roman et al. (2009) index


St

6.47715835501

Rcv

0.0515347354915

Rse

0.0

Rst

-0.0592608129977

Rsv

0.352370524589


NDVI range @ 1km [-]

0.06

NDVI range @ 2km [-]

0.22

NDVI range @ 5km [-]

0.32

NDVI range @ 10km [-]

0.38

NDVI range @ 20km [-]

0.32


Variance slope @ 1 km

0.000568536908483

Variance slope @ 2 km

0.000629794498868

Variance slope @ 5 km

0.00083052671723

Variance slope @ 10 km

0.000937621806184

Variance slope @ 20 km

0.000746967568782


NDVI (min. NDVI composite)I


Roman et al. (2009) index


St

5.8225363889

Rcv

-0.159763412452

Rse

0.0

Rst

-0.227862703023

Rsv

0.12761325782


NDVI range @ 1km [-]

0.05

NDVI range @ 2km [-]

0.13

NDVI range @ 5km [-]

0.14

NDVI range @ 10km [-]

0.19

NDVI range @ 20km [-]

0.17


NDVI slope @ 1 km

0.000208185585859

NDVI slope @ 2 km

0.000214843358748

NDVI slope @ 5 km

0.00022718749542

NDVI slope @ 10 km

0.000222826900794

NDVI slope @ 20 km

0.000192968533511


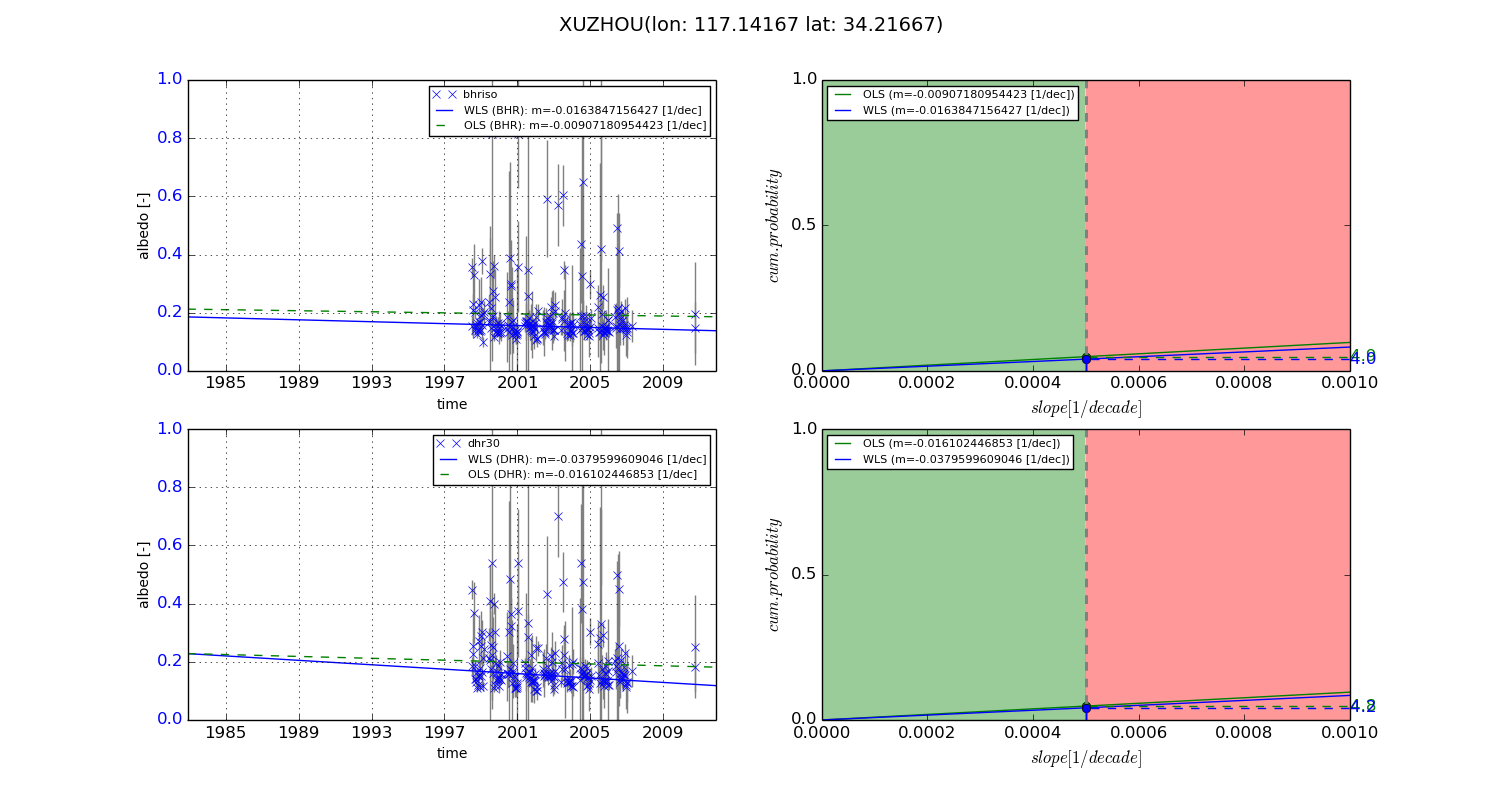
Temporal stability analysis

+000 deg (BHR)


BHR statistics

Temporal stability [1/decade]:


abs

rel


Weighted least square:

None


Ordinary least square:

None


Probabilities that GCOS criteria is met:

Weighted least square:

None %

Ordinary least square:

None %


DHR statistics

Temporal stability [1/decade]:


abs

rel


Weighted least square:

None


Ordinary least square:

None


Probabilities that GCOS criteria is met:

Weighted least square:

None %

Ordinary least square:

None %


+057/+063 deg (BHR)


BHR statistics

Temporal stability [1/decade]:


abs

rel


Weighted least square:

-0.0163847156427


Ordinary least square:

-0.00907180954423


Probabilities that GCOS criteria is met:

Weighted least square:

4.0 %

Ordinary least square:

4.9 %


DHR statistics

Temporal stability [1/decade]:


abs

rel


Weighted least square:

-0.0379599609046


Ordinary least square:

-0.016102446853


Probabilities that GCOS criteria is met:

Weighted least square:

4.2 %

Ordinary least square:

4.8 %


Temporal anomaly analyis

The variance of the temporal anomalies provides an additional measure about the stability of the signal AFTER removal of the mean seasonal cylce.

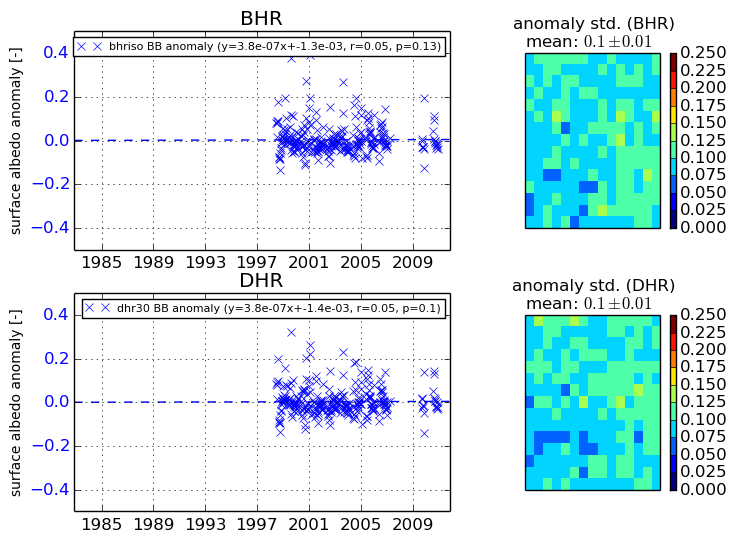
+000 deg


+057/+063 deg