YAKUTSK


Location

lon / lat [deg]: 129.3667 / 61.6617

Source network: AERONET


Geostationary surface albedo (GSA) data


“+000”


“+057/+063”


Landcover information (based on ESA CCI landcover data)


Landcover fractions @ 2km distance


Landcover fractions @ 20 km distance


Legend


Distance to open water bodies [km]:

0.56

Distance to urban areas [km]:

16.21


Radius: 1 km

Number of landcover classes:

3

Dominant landcover type:

150: Sparse vegetation (tree, shrub, herbaceous cover) (<15%)

Fraction of dominant landcover type [%]:

59.0


Radius: 2 km

Number of landcover classes:

5

Dominant landcover type:

150: Sparse vegetation (tree, shrub, herbaceous cover) (<15%)

Fraction of dominant landcover type [%]:

46.0


Radius: 5 km

Number of landcover classes:

6

Dominant landcover type:

80: Tree cover, needleleaved, deciduous, closed to open (>15%)

Fraction of dominant landcover type [%]:

40.0


Radius: 10 km

Number of landcover classes:

7

Dominant landcover type:

80: Tree cover, needleleaved, deciduous, closed to open (>15%)

Fraction of dominant landcover type [%]:

47.0


Radius: 20 km

Number of landcover classes:

7

Dominant landcover type:

80: Tree cover, needleleaved, deciduous, closed to open (>15%)

Fraction of dominant landcover type [%]:

59.0


Disturbances


Heterogeneity analysis

The heterogeneity analysis provides information about the spatial and temporal heterogeneity of the site.

Topography


Roman et al. (2009) index


St

1.31672952326e-06

Rcv

0.58966655501

Rse

0.0

Rst

0.0305145012334

Rsv

2278371.62485


Height range @ 1km [m]

13

Height range @ 2km [m]

13

Height range @ 5km [m]

157

Height range @ 10km [m]

-999

Height range @ 20km [m]

-999


Variance slope @ 1 km

440

Variance slope @ 2 km

541

Variance slope @ 5 km

606

Variance slope @ 10 km

-999

Variance slope @ 20 km

-999


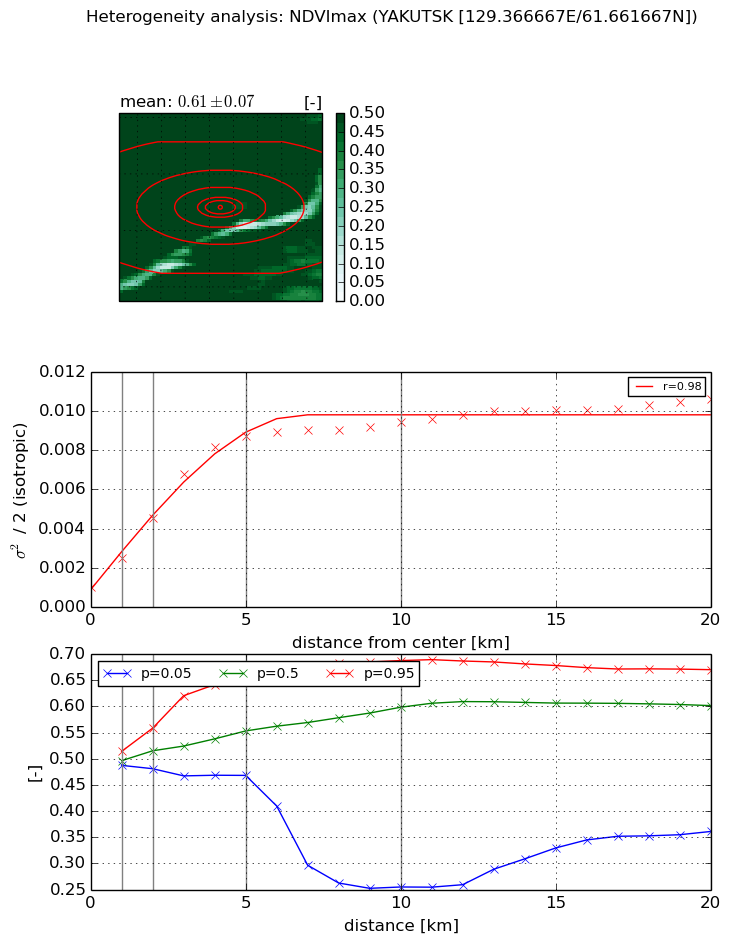
NDVI (max. NDVI composite)


Roman et al. (2009) index


St

nan

Rcv

nan

Rse

nan

Rst

nan

Rsv

nan


NDVI range @ 1km [-]

0.03

NDVI range @ 2km [-]

0.08

NDVI range @ 5km [-]

0.19

NDVI range @ 10km [-]

0.43

NDVI range @ 20km [-]

0.31


Variance slope @ 1 km

0.00144046746329

Variance slope @ 2 km

0.0017424894011

Variance slope @ 5 km

0.00165388893114

Variance slope @ 10 km

0.000796714246189

Variance slope @ 20 km

0.00034290177182


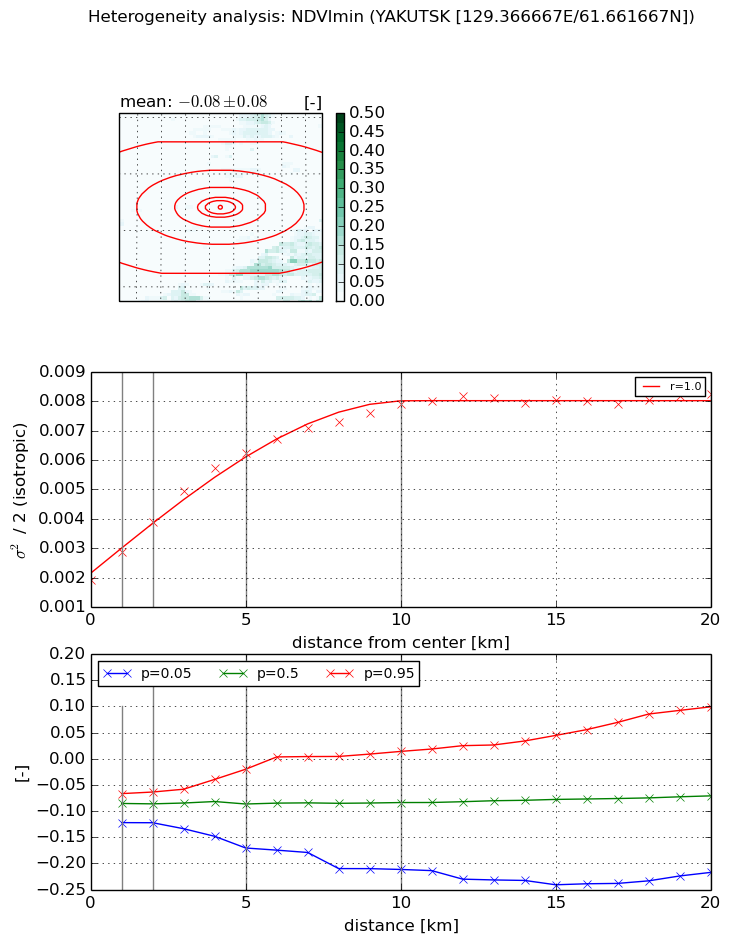
NDVI (min. NDVI composite)I


Roman et al. (2009) index


St

nan

Rcv

nan

Rse

nan

Rst

nan

Rsv

nan


NDVI range @ 1km [-]

0.06

NDVI range @ 2km [-]

0.06

NDVI range @ 5km [-]

0.15

NDVI range @ 10km [-]

0.23

NDVI range @ 20km [-]

0.32


NDVI slope @ 1 km

0.000963220654921

NDVI slope @ 2 km

0.000995381325459

NDVI slope @ 5 km

0.000891486741316

NDVI slope @ 10 km

0.000582420470998

NDVI slope @ 20 km

0.000256812779762


Temporal stability analysis

+000 deg (BHR)


BHR statistics

Temporal stability [1/decade]:


abs

rel


Weighted least square:

None


Ordinary least square:

None


Probabilities that GCOS criteria is met:

Weighted least square:

None %

Ordinary least square:

None %


DHR statistics

Temporal stability [1/decade]:


abs

rel


Weighted least square:

None


Ordinary least square:

None


Probabilities that GCOS criteria is met:

Weighted least square:

None %

Ordinary least square:

None %


+057/+063 deg (BHR)


BHR statistics

Temporal stability [1/decade]:


abs

rel


Weighted least square:

None


Ordinary least square:

None


Probabilities that GCOS criteria is met:

Weighted least square:

None %

Ordinary least square:

None %


DHR statistics

Temporal stability [1/decade]:


abs

rel


Weighted least square:

None


Ordinary least square:

None


Probabilities that GCOS criteria is met:

Weighted least square:

None %

Ordinary least square:

None %


Temporal anomaly analyis

The variance of the temporal anomalies provides an additional measure about the stability of the signal AFTER removal of the mean seasonal cylce.

+000 deg


+057/+063 deg