YEKATERINBURG


Location

lon / lat [deg]: 59.545 / 57.0383

Source network: AERONET


Geostationary surface albedo (GSA) data


“+000”


“+057/+063”


Landcover information (based on ESA CCI landcover data)


Landcover fractions @ 2km distance


Landcover fractions @ 20 km distance


Legend


Distance to open water bodies [km]:

3.2

Distance to urban areas [km]:

3.54


Radius: 1 km

Number of landcover classes:

3

Dominant landcover type:

70: Tree cover, needleleaved, evergreen, closed to open (>15%)

Fraction of dominant landcover type [%]:

58.0


Radius: 2 km

Number of landcover classes:

4

Dominant landcover type:

70: Tree cover, needleleaved, evergreen, closed to open (>15%)

Fraction of dominant landcover type [%]:

38.0


Radius: 5 km

Number of landcover classes:

6

Dominant landcover type:

60: Tree cover, broadleaved, decidous

Fraction of dominant landcover type [%]:

45.0


Radius: 10 km

Number of landcover classes:

6

Dominant landcover type:

60: Tree cover, broadleaved, decidous

Fraction of dominant landcover type [%]:

51.0


Radius: 20 km

Number of landcover classes:

5

Dominant landcover type:

60: Tree cover, broadleaved, decidous

Fraction of dominant landcover type [%]:

55.0


Disturbances


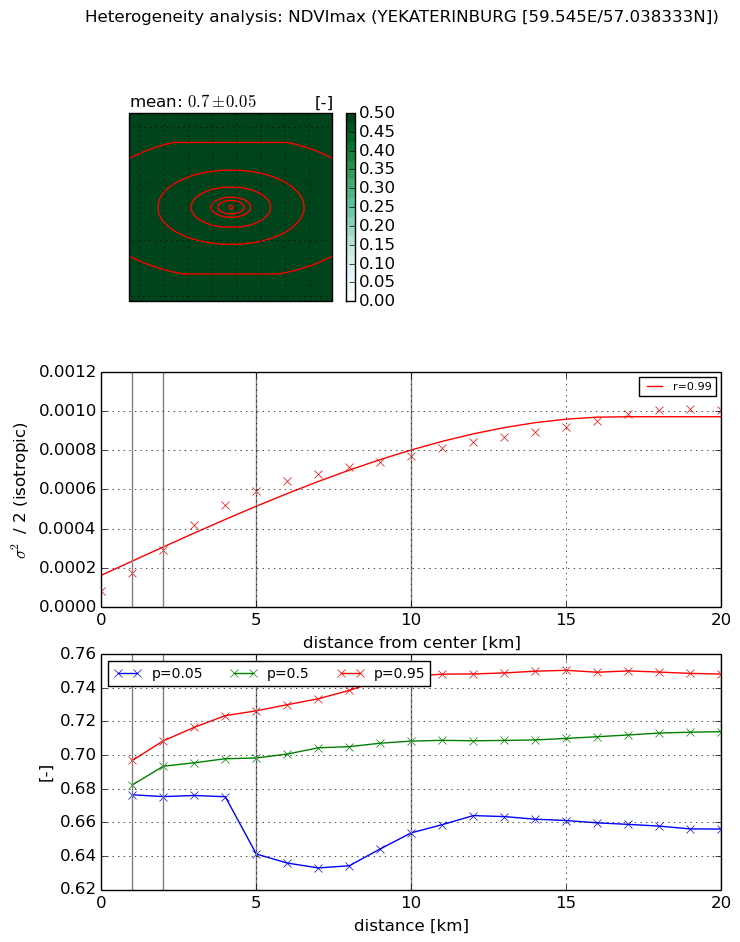
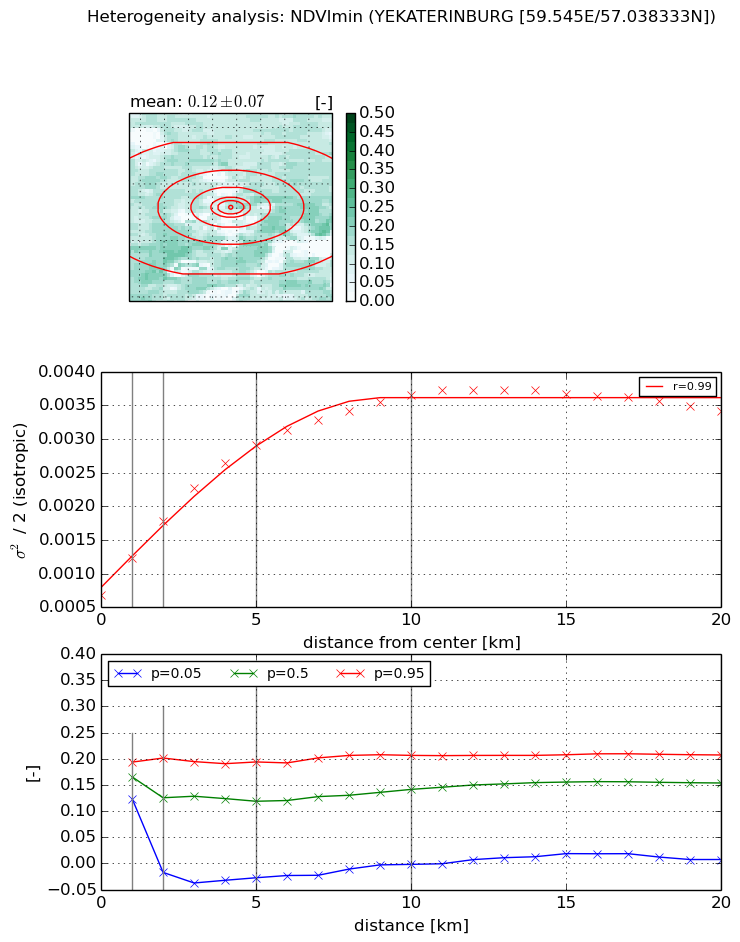
Heterogeneity analysis

The heterogeneity analysis provides information about the spatial and temporal heterogeneity of the site.

Topography


Roman et al. (2009) index


St

2.76889236119

Rcv

0.00627359946014

Rse

0.0

Rst

-0.114017017896

Rsv

0.963175118638


Height range @ 1km [m]

54

Height range @ 2km [m]

61

Height range @ 5km [m]

74

Height range @ 10km [m]

-999

Height range @ 20km [m]

-999


Variance slope @ 1 km

251

Variance slope @ 2 km

204

Variance slope @ 5 km

123

Variance slope @ 10 km

-999

Variance slope @ 20 km

-999


NDVI (max. NDVI composite)


Roman et al. (2009) index


St

0.167682878221

Rcv

0.707399845249

Rse

0.0

Rst

9.01560802524e-09

Rsv

17.1835144229


NDVI range @ 1km [-]

0.02

NDVI range @ 2km [-]

0.03

NDVI range @ 5km [-]

0.09

NDVI range @ 10km [-]

0.09

NDVI range @ 20km [-]

0.09


Variance slope @ 1 km

9.21672942071e-05

Variance slope @ 2 km

0.000104703070115

Variance slope @ 5 km

0.00010566365762

Variance slope @ 10 km

6.91469639639e-05

Variance slope @ 20 km

4.22036879498e-05


NDVI (min. NDVI composite)I


Roman et al. (2009) index


St

25.5244664916

Rcv

-0.0542614517865

Rse

0.0

Rst

-0.0114746065991

Rsv

-0.0517982297839


NDVI range @ 1km [-]

0.07

NDVI range @ 2km [-]

0.22

NDVI range @ 5km [-]

0.22

NDVI range @ 10km [-]

0.21

NDVI range @ 20km [-]

0.2


NDVI slope @ 1 km

0.000559025438863

NDVI slope @ 2 km

0.000552783526997

NDVI slope @ 5 km

0.000454198291886

NDVI slope @ 10 km

0.000286218191643

NDVI slope @ 20 km

0.000111437372974


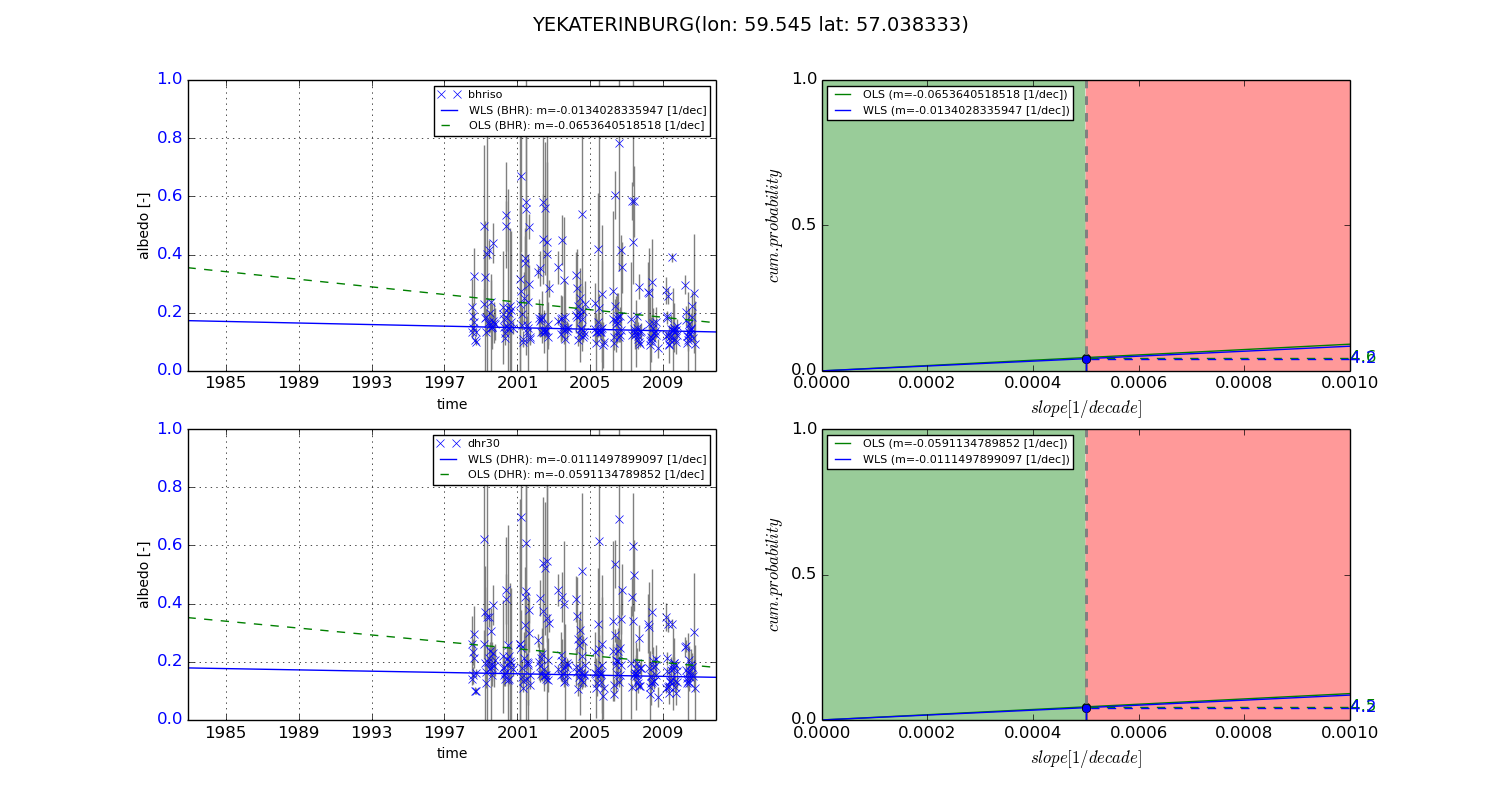
Temporal stability analysis

+000 deg (BHR)


BHR statistics

Temporal stability [1/decade]:


abs

rel


Weighted least square:

-99999.0


Ordinary least square:

-99999.0


Probabilities that GCOS criteria is met:

Weighted least square:

-99999.0 %

Ordinary least square:

-99999.0 %


DHR statistics

Temporal stability [1/decade]:


abs

rel


Weighted least square:

-99999.0


Ordinary least square:

-99999.0


Probabilities that GCOS criteria is met:

Weighted least square:

-99999.0 %

Ordinary least square:

-99999.0 %


+057/+063 deg (BHR)


BHR statistics

Temporal stability [1/decade]:


abs

rel


Weighted least square:

-0.0134028335947


Ordinary least square:

-0.0653640518518


Probabilities that GCOS criteria is met:

Weighted least square:

4.2 %

Ordinary least square:

4.6 %


DHR statistics

Temporal stability [1/decade]:


abs

rel


Weighted least square:

-0.0111497899097


Ordinary least square:

-0.0591134789852


Probabilities that GCOS criteria is met:

Weighted least square:

4.2 %

Ordinary least square:

4.5 %


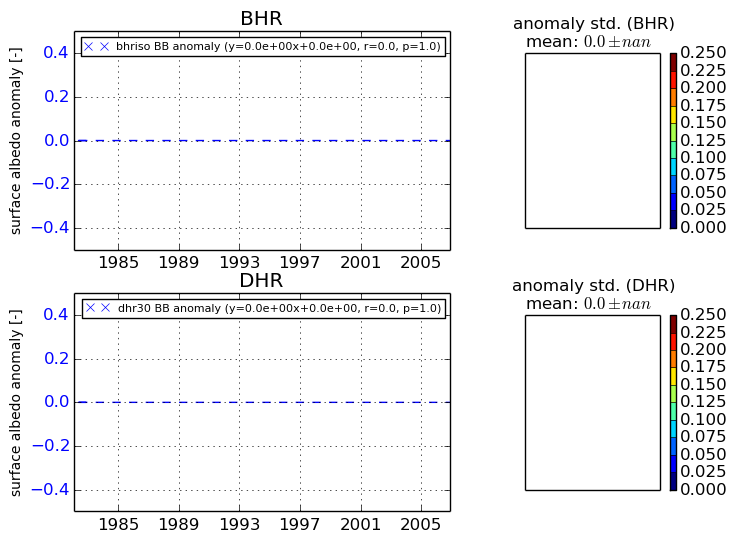
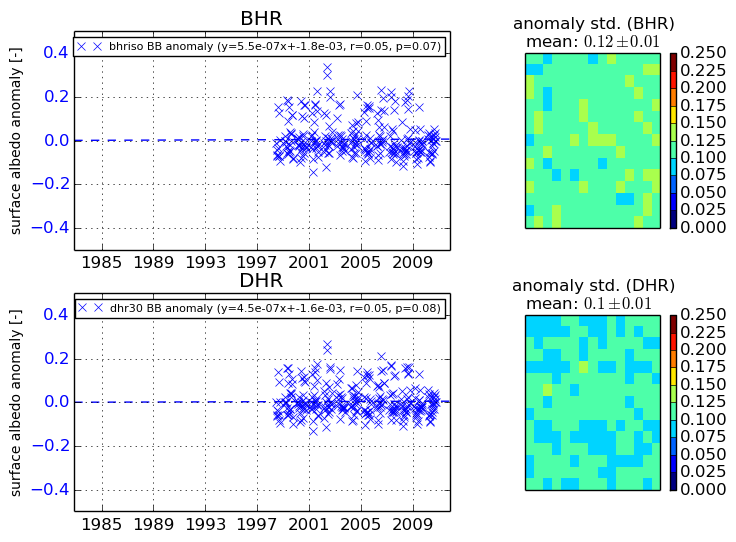
Temporal anomaly analyis

The variance of the temporal anomalies provides an additional measure about the stability of the signal AFTER removal of the mean seasonal cylce.
+000 deg


+057/+063 deg


By continuing to use this website, you are giving consent to analytic cookies being used. For more information on how EUMETSAT uses data and how you can disable this, please view this web page: Analytics Cookie Policy