YULIN


Location

lon / lat [deg]: 109.7167 / 38.2833

Source network: AERONET


Geostationary surface albedo (GSA) data


“+000”


“+057/+063”


Landcover information (based on ESA CCI landcover data)


Landcover fractions @ 2km distance


Landcover fractions @ 20 km distance


Legend


Distance to open water bodies [km]:

2.94

Distance to urban areas [km]:

1.15


Radius: 1 km

Number of landcover classes:

2

Dominant landcover type:

130: grassland

Fraction of dominant landcover type [%]:

80.0


Radius: 2 km

Number of landcover classes:

6

Dominant landcover type:

130: grassland

Fraction of dominant landcover type [%]:

68.0


Radius: 5 km

Number of landcover classes:

6

Dominant landcover type:

130: grassland

Fraction of dominant landcover type [%]:

63.0


Radius: 10 km

Number of landcover classes:

6

Dominant landcover type:

130: grassland

Fraction of dominant landcover type [%]:

69.0


Radius: 20 km

Number of landcover classes:

6

Dominant landcover type:

130: grassland

Fraction of dominant landcover type [%]:

73.0


Disturbances


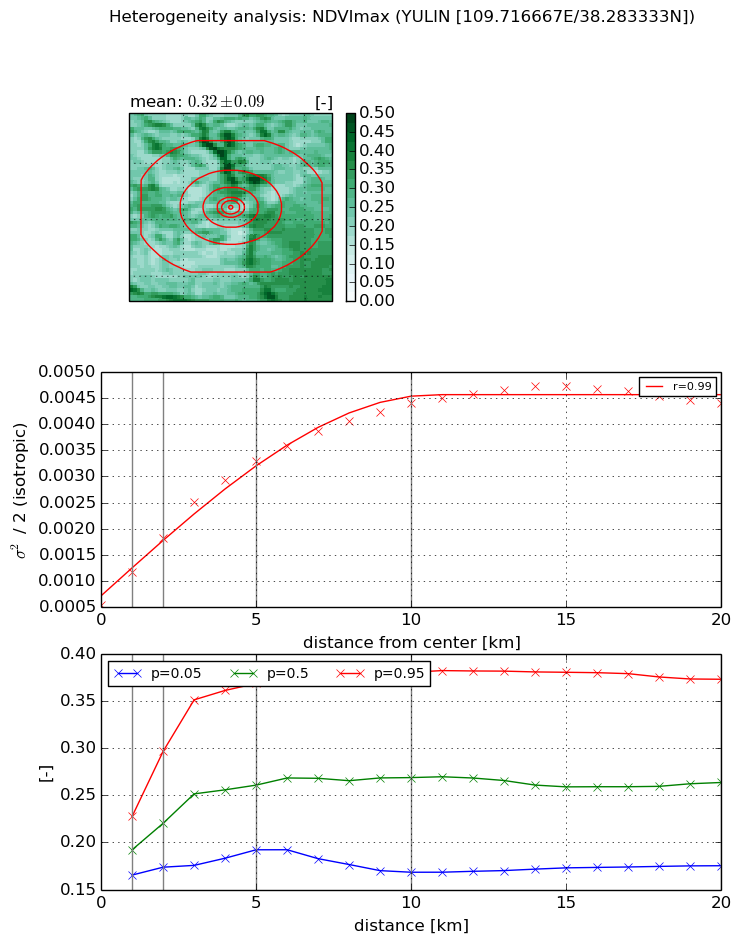
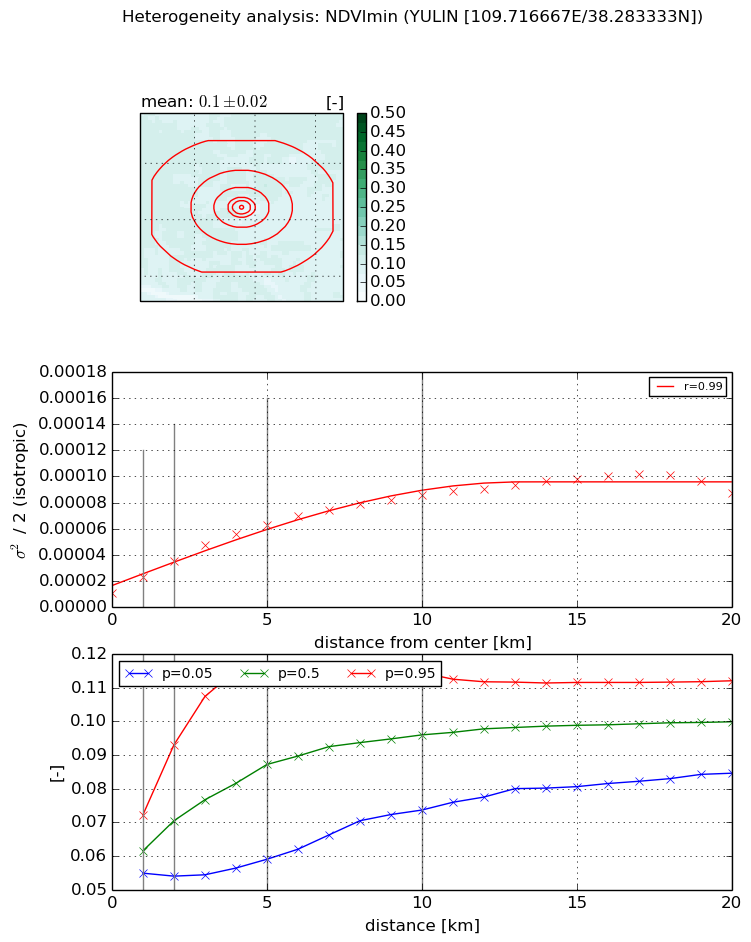
Heterogeneity analysis

The heterogeneity analysis provides information about the spatial and temporal heterogeneity of the site.

Topography


Roman et al. (2009) index


St

3.07383955908e-05

Rcv

0.00465120264846

Rse

0.0

Rst

0.0236261236723

Rsv

97597.7787109


Height range @ 1km [m]

39

Height range @ 2km [m]

79

Height range @ 5km [m]

107

Height range @ 10km [m]

-999

Height range @ 20km [m]

-999


Variance slope @ 1 km

228

Variance slope @ 2 km

253

Variance slope @ 5 km

243

Variance slope @ 10 km

-999

Variance slope @ 20 km

-999


NDVI (max. NDVI composite)


Roman et al. (2009) index


St

1.11341088493

Rcv

-0.00371090821646

Rse

0.0

Rst

-0.499378692208

Rsv

2.19133349225


NDVI range @ 1km [-]

0.06

NDVI range @ 2km [-]

0.12

NDVI range @ 5km [-]

0.18

NDVI range @ 10km [-]

0.21

NDVI range @ 20km [-]

0.2


Variance slope @ 1 km

0.000635626655601

Variance slope @ 2 km

0.000638577217859

Variance slope @ 5 km

0.000561110647195

Variance slope @ 10 km

0.000378857071034

Variance slope @ 20 km

0.000169945224156


NDVI (min. NDVI composite)I


Roman et al. (2009) index


St

6.94489290553

Rcv

-0.141962552339

Rse

0.0

Rst

-0.0655512873021

Rsv

-0.224458264294


NDVI range @ 1km [-]

0.02

NDVI range @ 2km [-]

0.04

NDVI range @ 5km [-]

0.05

NDVI range @ 10km [-]

0.04

NDVI range @ 20km [-]

0.03


NDVI slope @ 1 km

1.18777827682e-05

NDVI slope @ 2 km

1.19157151683e-05

NDVI slope @ 5 km

1.05847343456e-05

NDVI slope @ 10 km

7.35371828372e-06

NDVI slope @ 20 km

3.84885953988e-06


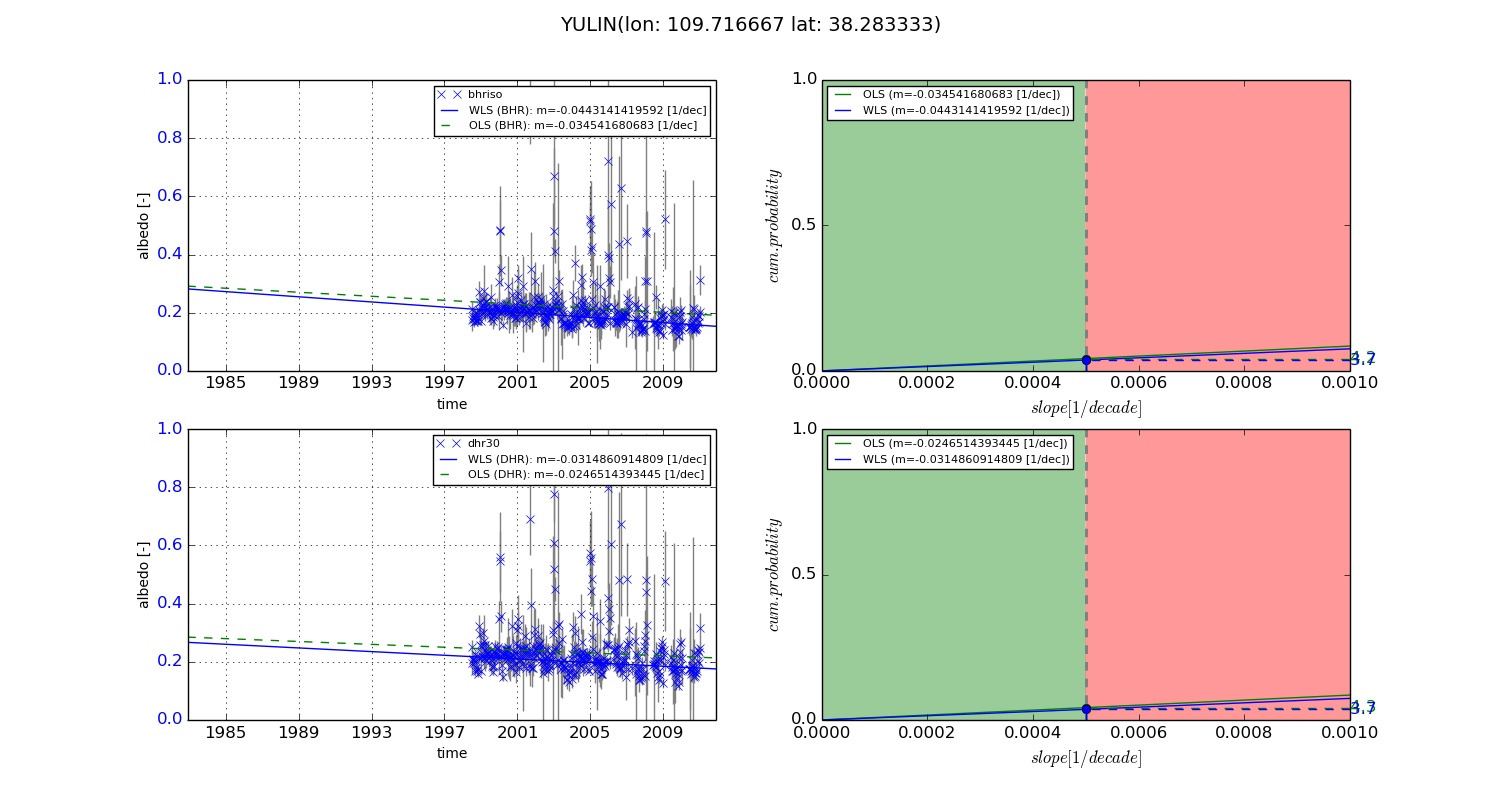
Temporal stability analysis

+000 deg (BHR)


BHR statistics

Temporal stability [1/decade]:


abs

rel


Weighted least square:

None


Ordinary least square:

None


Probabilities that GCOS criteria is met:

Weighted least square:

None %

Ordinary least square:

None %


DHR statistics

Temporal stability [1/decade]:


abs

rel


Weighted least square:

None


Ordinary least square:

None


Probabilities that GCOS criteria is met:

Weighted least square:

None %

Ordinary least square:

None %


+057/+063 deg (BHR)


BHR statistics

Temporal stability [1/decade]:


abs

rel


Weighted least square:

-0.0443141419592


Ordinary least square:

-0.034541680683


Probabilities that GCOS criteria is met:

Weighted least square:

3.7 %

Ordinary least square:

4.2 %


DHR statistics

Temporal stability [1/decade]:


abs

rel


Weighted least square:

-0.0314860914809


Ordinary least square:

-0.0246514393445


Probabilities that GCOS criteria is met:

Weighted least square:

3.7 %

Ordinary least square:

4.3 %


Temporal anomaly analyis

The variance of the temporal anomalies provides an additional measure about the stability of the signal AFTER removal of the mean seasonal cylce.

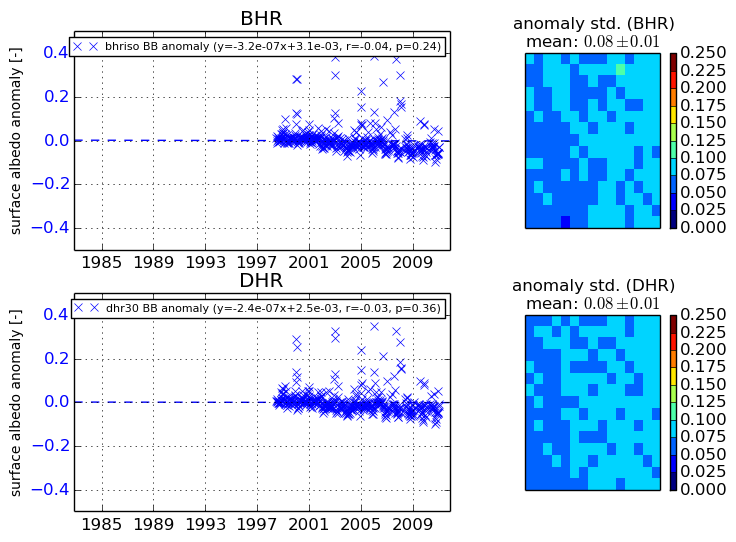
+000 deg


+057/+063 deg