YUMA


Location

lon / lat [deg]: -114.5828 / 32.6441

Source network: AERONET


Geostationary surface albedo (GSA) data


“+000”


“+057/+063”


Landcover information (based on ESA CCI landcover data)


Landcover fractions @ 2km distance


Landcover fractions @ 20 km distance


Legend


Distance to open water bodies [km]:

9.29

Distance to urban areas [km]:

0.26


Radius: 1 km

Number of landcover classes:

4

Dominant landcover type:

10: cropland, rainfed

Fraction of dominant landcover type [%]:

46.0


Radius: 2 km

Number of landcover classes:

4

Dominant landcover type:

10: cropland, rainfed

Fraction of dominant landcover type [%]:

49.0


Radius: 5 km

Number of landcover classes:

3

Dominant landcover type:

10: cropland, rainfed

Fraction of dominant landcover type [%]:

45.0


Radius: 10 km

Number of landcover classes:

3

Dominant landcover type:

120: Shrubland

Fraction of dominant landcover type [%]:

41.0


Radius: 20 km

Number of landcover classes:

3

Dominant landcover type:

120: Shrubland

Fraction of dominant landcover type [%]:

59.0


Disturbances


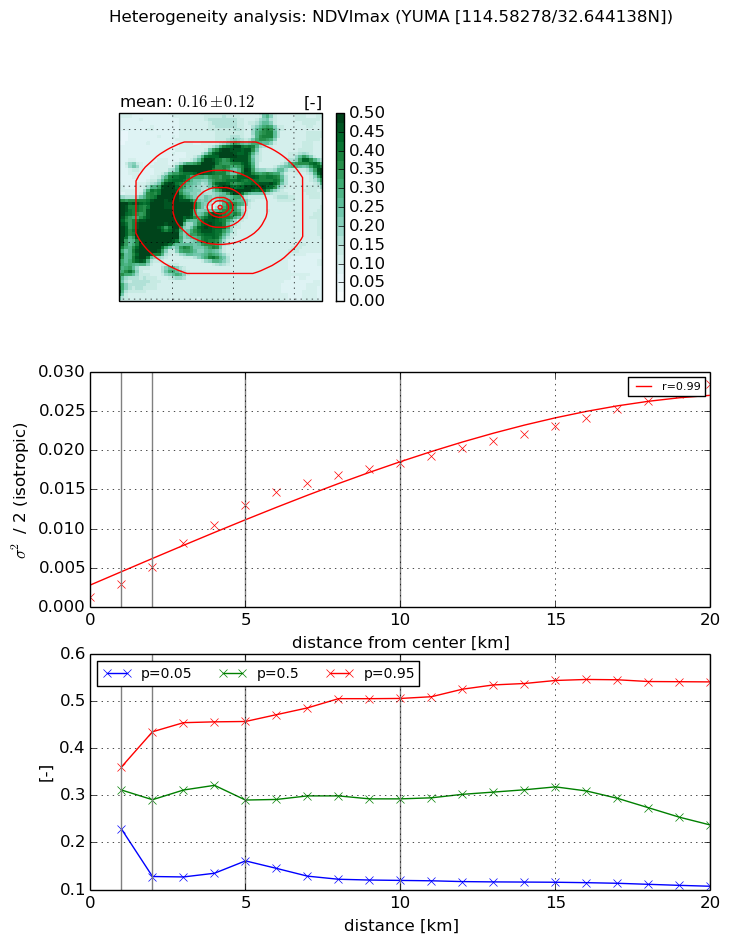
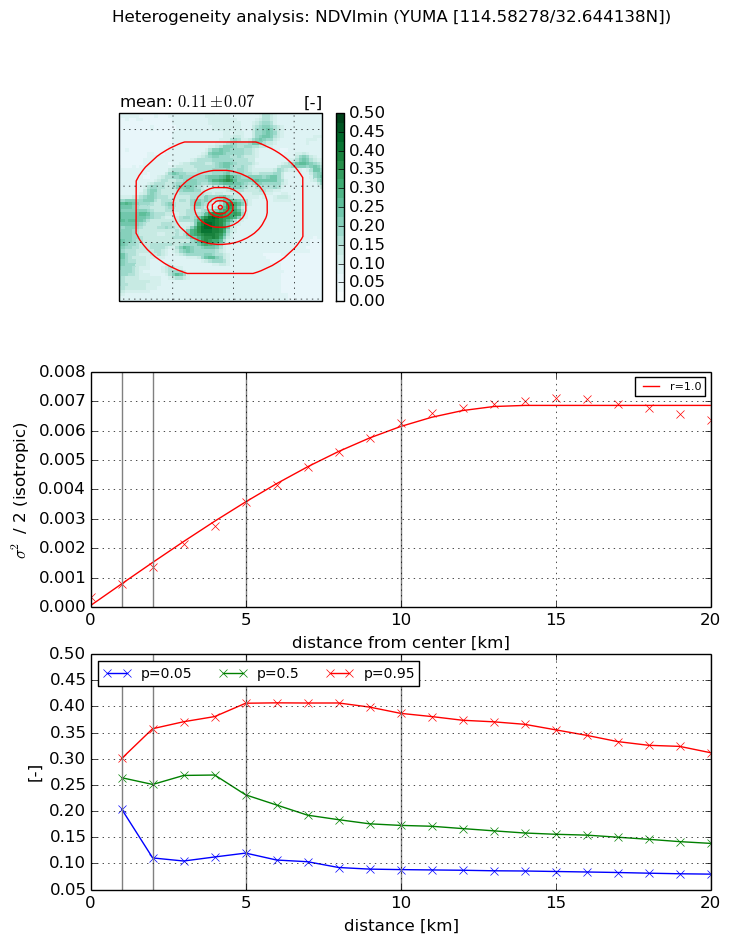
Heterogeneity analysis

The heterogeneity analysis provides information about the spatial and temporal heterogeneity of the site.

Topography


Roman et al. (2009) index


St

16.5527656722

Rcv

-0.0560595152704

Rse

0.0

Rst

0.0743453680078

Rsv

-0.0508337120969


Height range @ 1km [m]

7

Height range @ 2km [m]

10

Height range @ 5km [m]

11

Height range @ 10km [m]

-999

Height range @ 20km [m]

-999


Variance slope @ 1 km

16

Variance slope @ 2 km

10

Variance slope @ 5 km

5

Variance slope @ 10 km

-999

Variance slope @ 20 km

-999


NDVI (max. NDVI composite)


Roman et al. (2009) index


St

17.0996636682

Rcv

-0.0911754802036

Rse

0.0

Rst

-0.0606388970488

Rsv

-0.0236276699252


NDVI range @ 1km [-]

0.13

NDVI range @ 2km [-]

0.31

NDVI range @ 5km [-]

0.3

NDVI range @ 10km [-]

0.39

NDVI range @ 20km [-]

0.43


Variance slope @ 1 km

0.00172321706037

Variance slope @ 2 km

0.00194297164851

Variance slope @ 5 km

0.00240809627304

Variance slope @ 10 km

0.00180201375881

Variance slope @ 20 km

0.00125031143247


NDVI (min. NDVI composite)I


Roman et al. (2009) index


St

nan

Rcv

nan

Rse

nan

Rst

nan

Rsv

nan


NDVI range @ 1km [-]

0.1

NDVI range @ 2km [-]

0.25

NDVI range @ 5km [-]

0.29

NDVI range @ 10km [-]

0.3

NDVI range @ 20km [-]

0.23


NDVI slope @ 1 km

0.000452378796097

NDVI slope @ 2 km

0.000512264950962

NDVI slope @ 5 km

0.00065249196724

NDVI slope @ 10 km

0.000616724832718

NDVI slope @ 20 km

0.000329822893131


Temporal stability analysis

+000 deg (BHR)


BHR statistics

Temporal stability [1/decade]:


abs

rel


Weighted least square:

None


Ordinary least square:

None


Probabilities that GCOS criteria is met:

Weighted least square:

None %

Ordinary least square:

None %


DHR statistics

Temporal stability [1/decade]:


abs

rel


Weighted least square:

None


Ordinary least square:

None


Probabilities that GCOS criteria is met:

Weighted least square:

None %

Ordinary least square:

None %


+057/+063 deg (BHR)


BHR statistics

Temporal stability [1/decade]:


abs

rel


Weighted least square:

None


Ordinary least square:

None


Probabilities that GCOS criteria is met:

Weighted least square:

None %

Ordinary least square:

None %


DHR statistics

Temporal stability [1/decade]:


abs

rel


Weighted least square:

None


Ordinary least square:

None


Probabilities that GCOS criteria is met:

Weighted least square:

None %

Ordinary least square:

None %


Temporal anomaly analyis

The variance of the temporal anomalies provides an additional measure about the stability of the signal AFTER removal of the mean seasonal cylce.

+000 deg


+057/+063 deg