YUSHAN


Location

lon / lat [deg]: 120.9517 / 23.4893

Source network: AERONET


Geostationary surface albedo (GSA) data


“+000”


“+057/+063”


Landcover information (based on ESA CCI landcover data)


Landcover fractions @ 2km distance


Landcover fractions @ 20 km distance


Legend


Distance to open water bodies [km]:

0.42

Distance to urban areas [km]:

33.87


Radius: 1 km

Number of landcover classes:

2

Dominant landcover type:

50: Tree cover, broadleaved, evergreen, closed to open (>15%)

Fraction of dominant landcover type [%]:

94.0


Radius: 2 km

Number of landcover classes:

2

Dominant landcover type:

50: Tree cover, broadleaved, evergreen, closed to open (>15%)

Fraction of dominant landcover type [%]:

97.0


Radius: 5 km

Number of landcover classes:

2

Dominant landcover type:

50: Tree cover, broadleaved, evergreen, closed to open (>15%)

Fraction of dominant landcover type [%]:

97.0


Radius: 10 km

Number of landcover classes:

1

Dominant landcover type:

50: Tree cover, broadleaved, evergreen, closed to open (>15%)

Fraction of dominant landcover type [%]:

98.0


Radius: 20 km

Number of landcover classes:

1

Dominant landcover type:

50: Tree cover, broadleaved, evergreen, closed to open (>15%)

Fraction of dominant landcover type [%]:

98.0


Disturbances


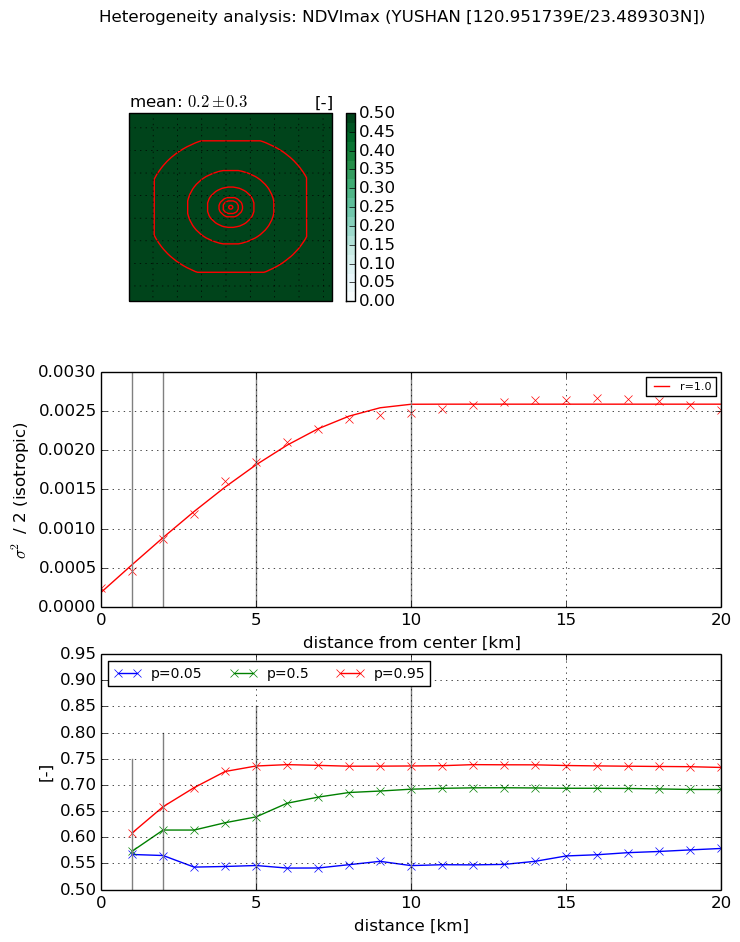
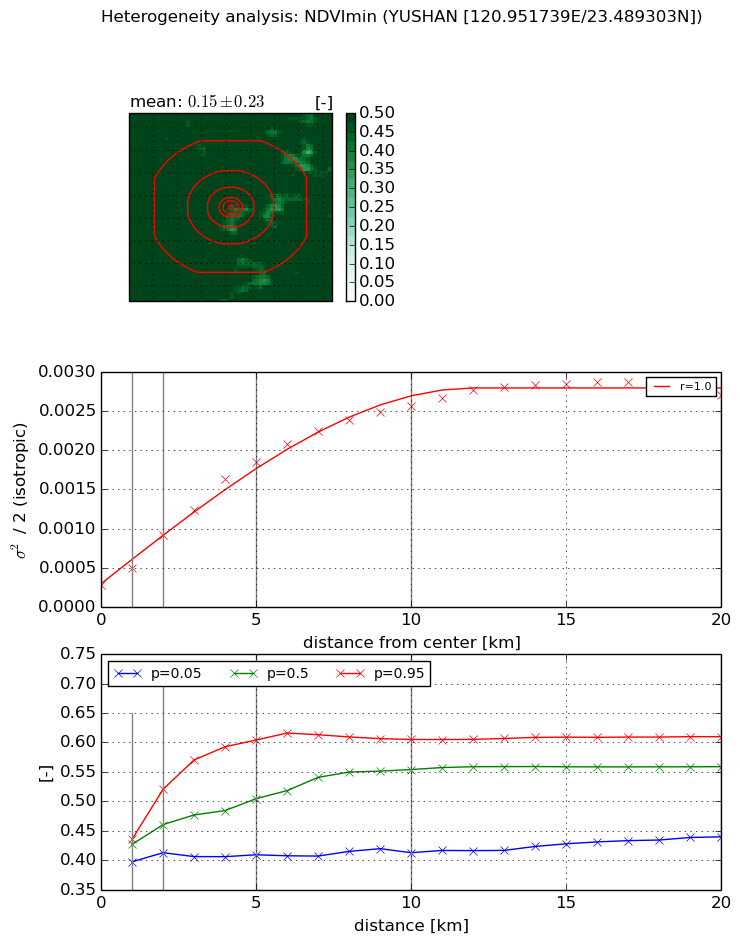
Heterogeneity analysis

The heterogeneity analysis provides information about the spatial and temporal heterogeneity of the site.

Topography


Roman et al. (2009) index


St

0.885570898856

Rcv

0.454038620396

Rse

0.0

Rst

3.26610250304e-08

Rsv

2.93360654156


Height range @ 1km [m]

899

Height range @ 2km [m]

1319

Height range @ 5km [m]

1910

Height range @ 10km [m]

-999

Height range @ 20km [m]

-999


Variance slope @ 1 km

63370

Variance slope @ 2 km

72395

Variance slope @ 5 km

75658

Variance slope @ 10 km

-999

Variance slope @ 20 km

-999


NDVI (max. NDVI composite)


Roman et al. (2009) index


St

6.02436750659e-06

Rcv

0.207411914915

Rse

0.0

Rst

0.222542612619

Rsv

497977.158019


NDVI range @ 1km [-]

0.04

NDVI range @ 2km [-]

0.09

NDVI range @ 5km [-]

0.19

NDVI range @ 10km [-]

0.19

NDVI range @ 20km [-]

0.15


Variance slope @ 1 km

0.000207577664477

Variance slope @ 2 km

0.000309180592544

Variance slope @ 5 km

0.000336556658859

Variance slope @ 10 km

0.000240171937213

Variance slope @ 20 km

0.000103946504622


NDVI (min. NDVI composite)I


Roman et al. (2009) index


St

7.24311320486e-08

Rcv

0.116536612839

Rse

0.0

Rst

0.23846285502

Rsv

41418653.6844


NDVI range @ 1km [-]

0.04

NDVI range @ 2km [-]

0.11

NDVI range @ 5km [-]

0.2

NDVI range @ 10km [-]

0.19

NDVI range @ 20km [-]

0.17


NDVI slope @ 1 km

0.000218056847732

NDVI slope @ 2 km

0.000320901938454

NDVI slope @ 5 km

0.000330731069094

NDVI slope @ 10 km

0.000238780956525

NDVI slope @ 20 km

0.000116758506287


Temporal stability analysis

+000 deg (BHR)


BHR statistics

Temporal stability [1/decade]:


abs

rel


Weighted least square:

None


Ordinary least square:

None


Probabilities that GCOS criteria is met:

Weighted least square:

None %

Ordinary least square:

None %


DHR statistics

Temporal stability [1/decade]:


abs

rel


Weighted least square:

None


Ordinary least square:

None


Probabilities that GCOS criteria is met:

Weighted least square:

None %

Ordinary least square:

None %


+057/+063 deg (BHR)


BHR statistics

Temporal stability [1/decade]:


abs

rel


Weighted least square:

-99999.0


Ordinary least square:

-99999.0


Probabilities that GCOS criteria is met:

Weighted least square:

-99999.0 %

Ordinary least square:

-99999.0 %


DHR statistics

Temporal stability [1/decade]:


abs

rel


Weighted least square:

-99999.0


Ordinary least square:

-99999.0


Probabilities that GCOS criteria is met:

Weighted least square:

-99999.0 %

Ordinary least square:

-99999.0 %


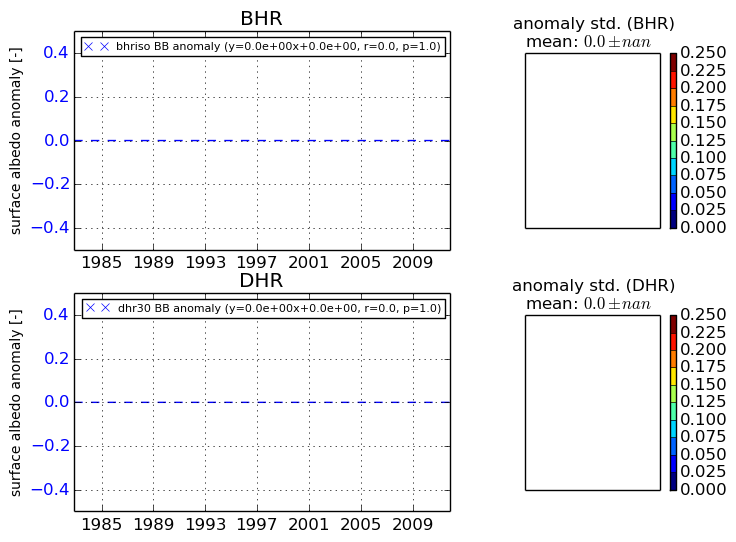
Temporal anomaly analyis

The variance of the temporal anomalies provides an additional measure about the stability of the signal AFTER removal of the mean seasonal cylce.

+000 deg


+057/+063 deg