ZARAGOZA


Location

lon / lat [deg]: -0.8824 / 41.6334

Source network: AERONET


Geostationary surface albedo (GSA) data


“+000”


“+057/+063”


Landcover information (based on ESA CCI landcover data)


Landcover fractions @ 2km distance


Landcover fractions @ 20 km distance


Legend


Distance to open water bodies [km]:

5.02

Distance to urban areas [km]:

0.15


Radius: 1 km

Number of landcover classes:

1

Dominant landcover type:

190: urban areas

Fraction of dominant landcover type [%]:

100.0


Radius: 2 km

Number of landcover classes:

5

Dominant landcover type:

190: urban areas

Fraction of dominant landcover type [%]:

87.0


Radius: 5 km

Number of landcover classes:

5

Dominant landcover type:

190: urban areas

Fraction of dominant landcover type [%]:

69.0


Radius: 10 km

Number of landcover classes:

5

Dominant landcover type:

190: urban areas

Fraction of dominant landcover type [%]:

38.0


Radius: 20 km

Number of landcover classes:

5

Dominant landcover type:

150: Sparse vegetation (tree, shrub, herbaceous cover) (<15%)

Fraction of dominant landcover type [%]:

41.0


Disturbances


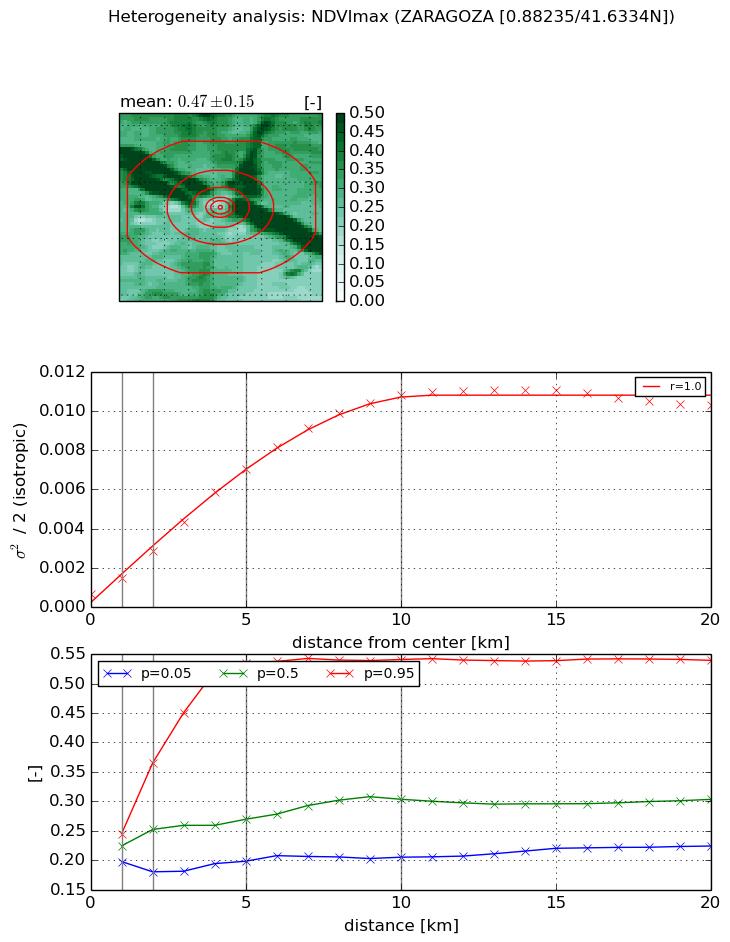
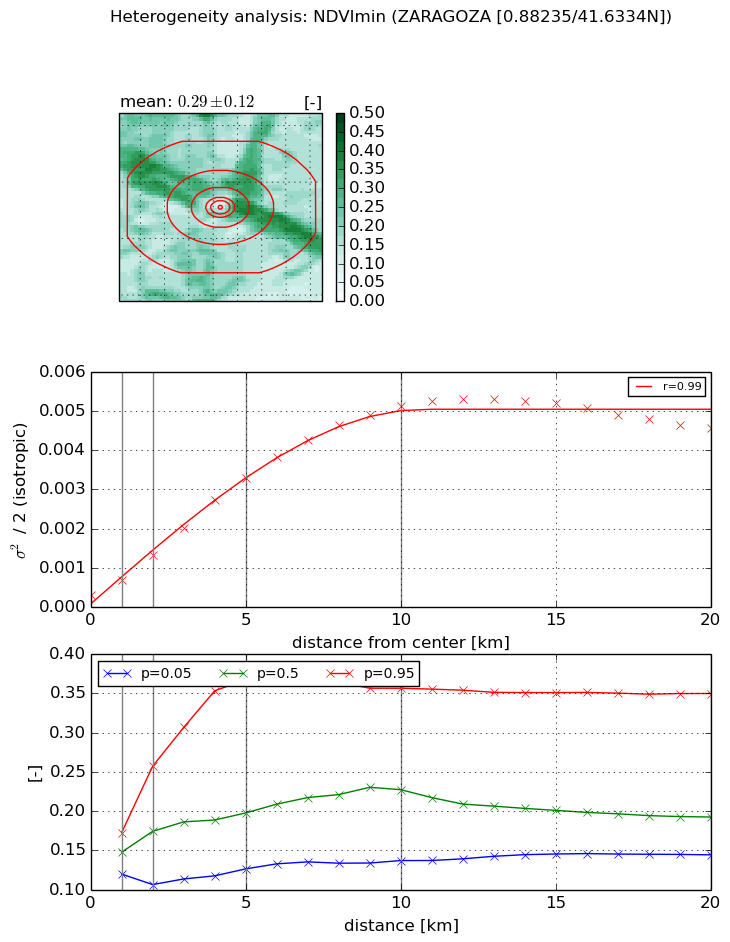
Heterogeneity analysis

The heterogeneity analysis provides information about the spatial and temporal heterogeneity of the site.

Topography


Roman et al. (2009) index


St

3.98302507777

Rcv

0.477230461225

Rse

0.0

Rst

-6.9406483385e-07

Rsv

-0.275965207128


Height range @ 1km [m]

44

Height range @ 2km [m]

66

Height range @ 5km [m]

120

Height range @ 10km [m]

-999

Height range @ 20km [m]

-999


Variance slope @ 1 km

146

Variance slope @ 2 km

180

Variance slope @ 5 km

304

Variance slope @ 10 km

-999

Variance slope @ 20 km

-999


NDVI (max. NDVI composite)


Roman et al. (2009) index


St

3.11705777916

Rcv

0.210693767998

Rse

0.0

Rst

-0.0598007720127

Rsv

0.691951526935


NDVI range @ 1km [-]

0.05

NDVI range @ 2km [-]

0.19

NDVI range @ 5km [-]

0.34

NDVI range @ 10km [-]

0.34

NDVI range @ 20km [-]

0.32


Variance slope @ 1 km

0.000832688252269

Variance slope @ 2 km

0.00110848674155

Variance slope @ 5 km

0.00132958370759

Variance slope @ 10 km

0.00108524502658

Variance slope @ 20 km

0.000458258314388


NDVI (min. NDVI composite)I


Roman et al. (2009) index


St

1.43382682976e-07

Rcv

0.0520545100067

Rse

0.0

Rst

0.0551354620207

Rsv

20923028.6557


NDVI range @ 1km [-]

0.05

NDVI range @ 2km [-]

0.15

NDVI range @ 5km [-]

0.24

NDVI range @ 10km [-]

0.22

NDVI range @ 20km [-]

0.21


NDVI slope @ 1 km

0.000385130386572

NDVI slope @ 2 km

0.000512091780439

NDVI slope @ 5 km

0.000624103693378

NDVI slope @ 10 km

0.000515037747863

NDVI slope @ 20 km

0.000208542168225


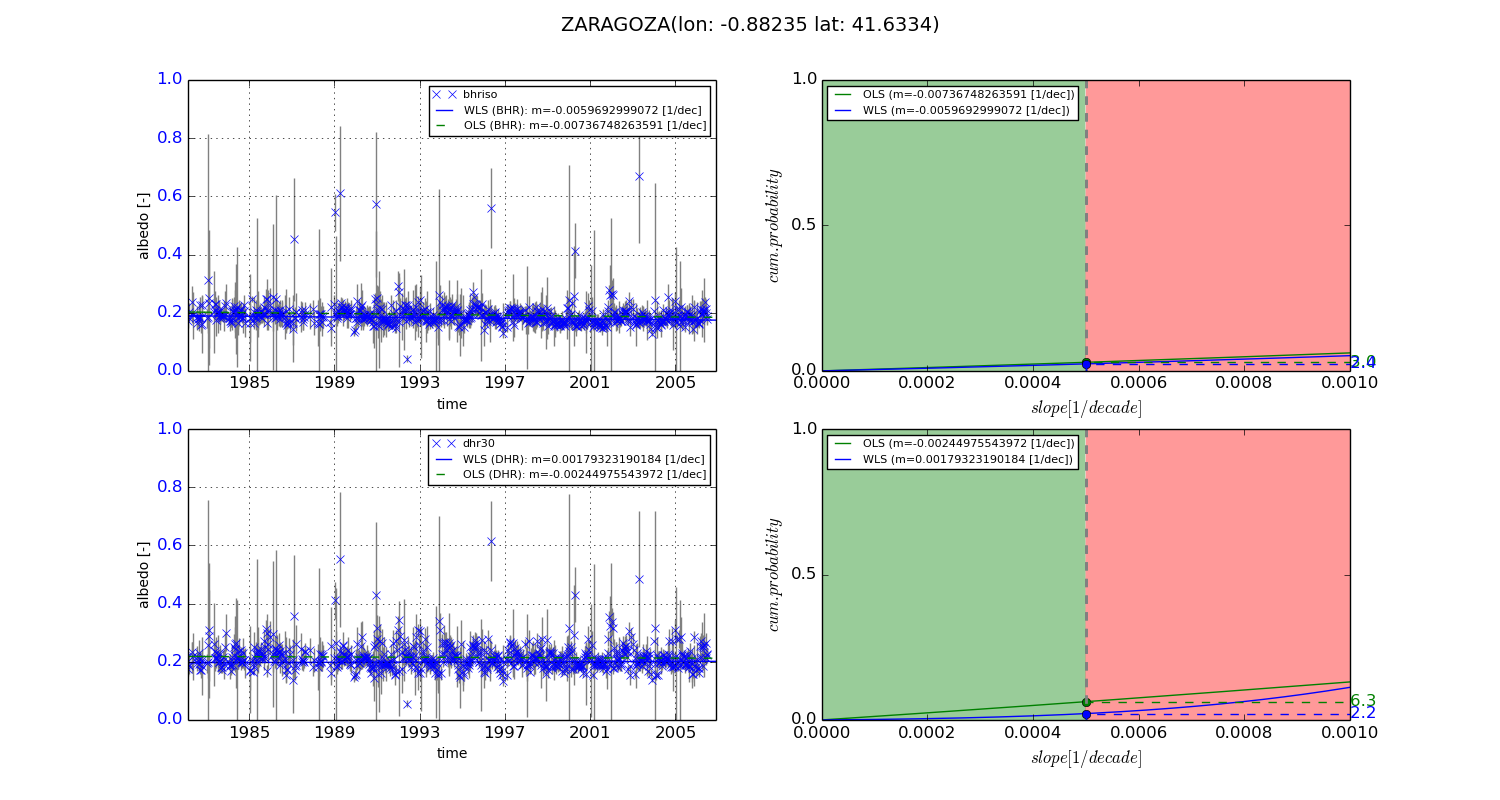
Temporal stability analysis

+000 deg (BHR)


BHR statistics

Temporal stability [1/decade]:


abs

rel


Weighted least square:

-0.0059692999072


Ordinary least square:

-0.00736748263591


Probabilities that GCOS criteria is met:

Weighted least square:

2.4 %

Ordinary least square:

3.0 %


DHR statistics

Temporal stability [1/decade]:


abs

rel


Weighted least square:

0.00179323190184


Ordinary least square:

-0.00244975543972


Probabilities that GCOS criteria is met:

Weighted least square:

2.2 %

Ordinary least square:

6.3 %


+057/+063 deg (BHR)


BHR statistics

Temporal stability [1/decade]:


abs

rel


Weighted least square:

-99999.0


Ordinary least square:

-99999.0


Probabilities that GCOS criteria is met:

Weighted least square:

-99999.0 %

Ordinary least square:

-99999.0 %


DHR statistics

Temporal stability [1/decade]:


abs

rel


Weighted least square:

-99999.0


Ordinary least square:

-99999.0


Probabilities that GCOS criteria is met:

Weighted least square:

-99999.0 %

Ordinary least square:

-99999.0 %


Temporal anomaly analyis

The variance of the temporal anomalies provides an additional measure about the stability of the signal AFTER removal of the mean seasonal cylce.
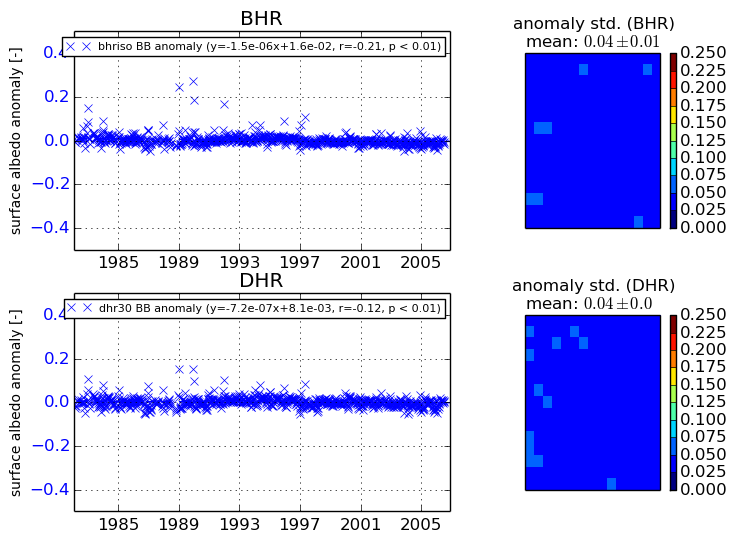
+000 deg


+057/+063 deg