ZINDER_DMN


Location

lon / lat [deg]: 8.9841 / 13.7754

Source network: AERONET


Geostationary surface albedo (GSA) data


“+000”


“+057/+063”


Landcover information (based on ESA CCI landcover data)


Landcover fractions @ 2km distance


Landcover fractions @ 20 km distance


Legend


Distance to open water bodies [km]:

18.86

Distance to urban areas [km]:

1.64


Radius: 1 km

Number of landcover classes:

2

Dominant landcover type:

130: grassland

Fraction of dominant landcover type [%]:

97.0


Radius: 2 km

Number of landcover classes:

3

Dominant landcover type:

130: grassland

Fraction of dominant landcover type [%]:

53.0


Radius: 5 km

Number of landcover classes:

5

Dominant landcover type:

10: cropland, rainfed

Fraction of dominant landcover type [%]:

54.0


Radius: 10 km

Number of landcover classes:

5

Dominant landcover type:

10: cropland, rainfed

Fraction of dominant landcover type [%]:

64.0


Radius: 20 km

Number of landcover classes:

6

Dominant landcover type:

10: cropland, rainfed

Fraction of dominant landcover type [%]:

73.0


Disturbances


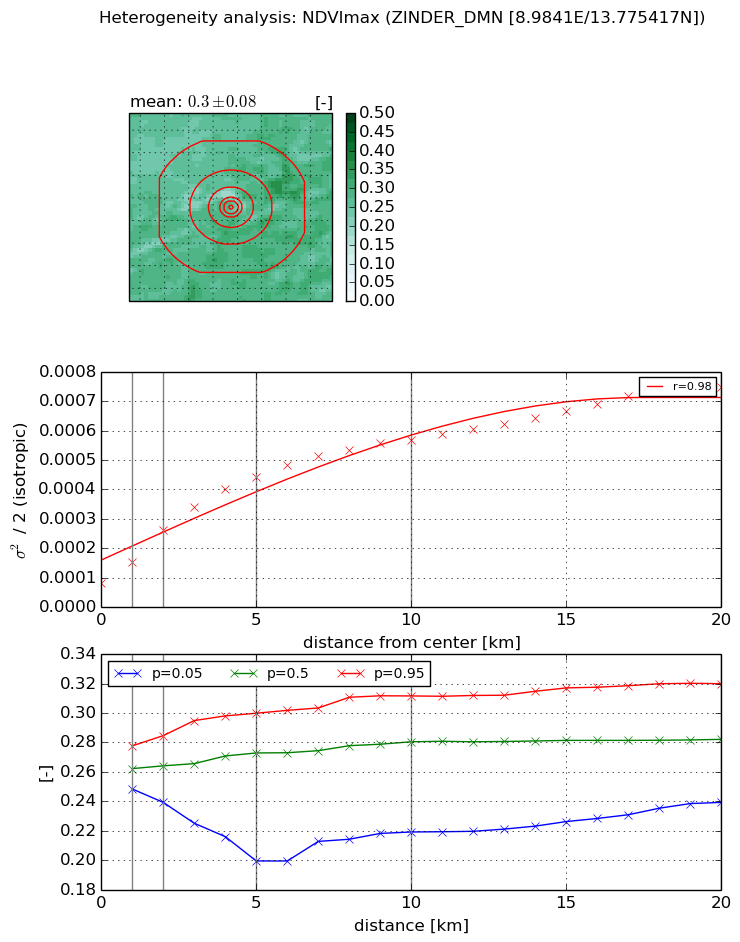
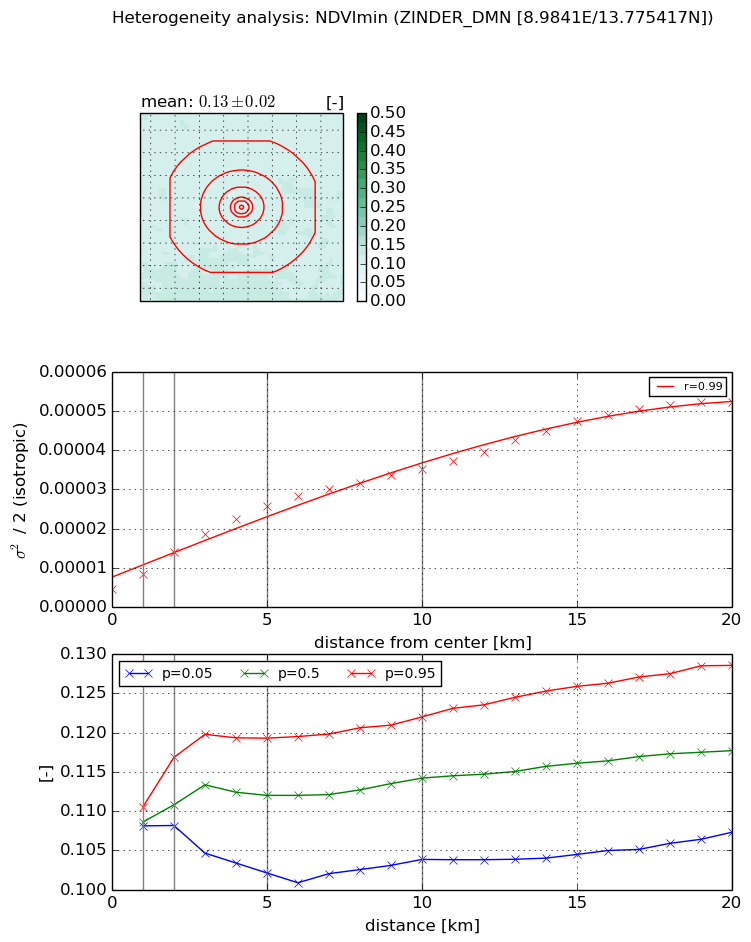
Heterogeneity analysis

The heterogeneity analysis provides information about the spatial and temporal heterogeneity of the site.

Topography


Roman et al. (2009) index


St

0.000630139987574

Rcv

0.00371416999958

Rse

0.0

Rst

-0.0873391954197

Rsv

4760.75583646


Height range @ 1km [m]

17

Height range @ 2km [m]

19

Height range @ 5km [m]

27

Height range @ 10km [m]

-999

Height range @ 20km [m]

-999


Variance slope @ 1 km

30

Variance slope @ 2 km

25

Variance slope @ 5 km

14

Variance slope @ 10 km

-999

Variance slope @ 20 km

-999


NDVI (max. NDVI composite)


Roman et al. (2009) index


St

5.03782929138e-08

Rcv

0.184675624365

Rse

0.0

Rst

0.175758014364

Rsv

59549456.8857


NDVI range @ 1km [-]

0.03

NDVI range @ 2km [-]

0.05

NDVI range @ 5km [-]

0.1

NDVI range @ 10km [-]

0.09

NDVI range @ 20km [-]

0.08


Variance slope @ 1 km

7.10324593701e-05

Variance slope @ 2 km

8.93736331705e-05

Variance slope @ 5 km

7.45519256915e-05

Variance slope @ 10 km

4.8040689632e-05

Variance slope @ 20 km

2.8990741978e-05


NDVI (min. NDVI composite)I


Roman et al. (2009) index


St

1.78291462327

Rcv

0.160609613327

Rse

0.0

Rst

-0.522034869368

Rsv

-0.999993575705


NDVI range @ 1km [-]

0.0

NDVI range @ 2km [-]

0.01

NDVI range @ 5km [-]

0.02

NDVI range @ 10km [-]

0.02

NDVI range @ 20km [-]

0.02


NDVI slope @ 1 km

3.8030095096e-06

NDVI slope @ 2 km

4.79211324641e-06

NDVI slope @ 5 km

4.35231955166e-06

NDVI slope @ 10 km

3.05477213847e-06

NDVI slope @ 20 km

2.31718160501e-06


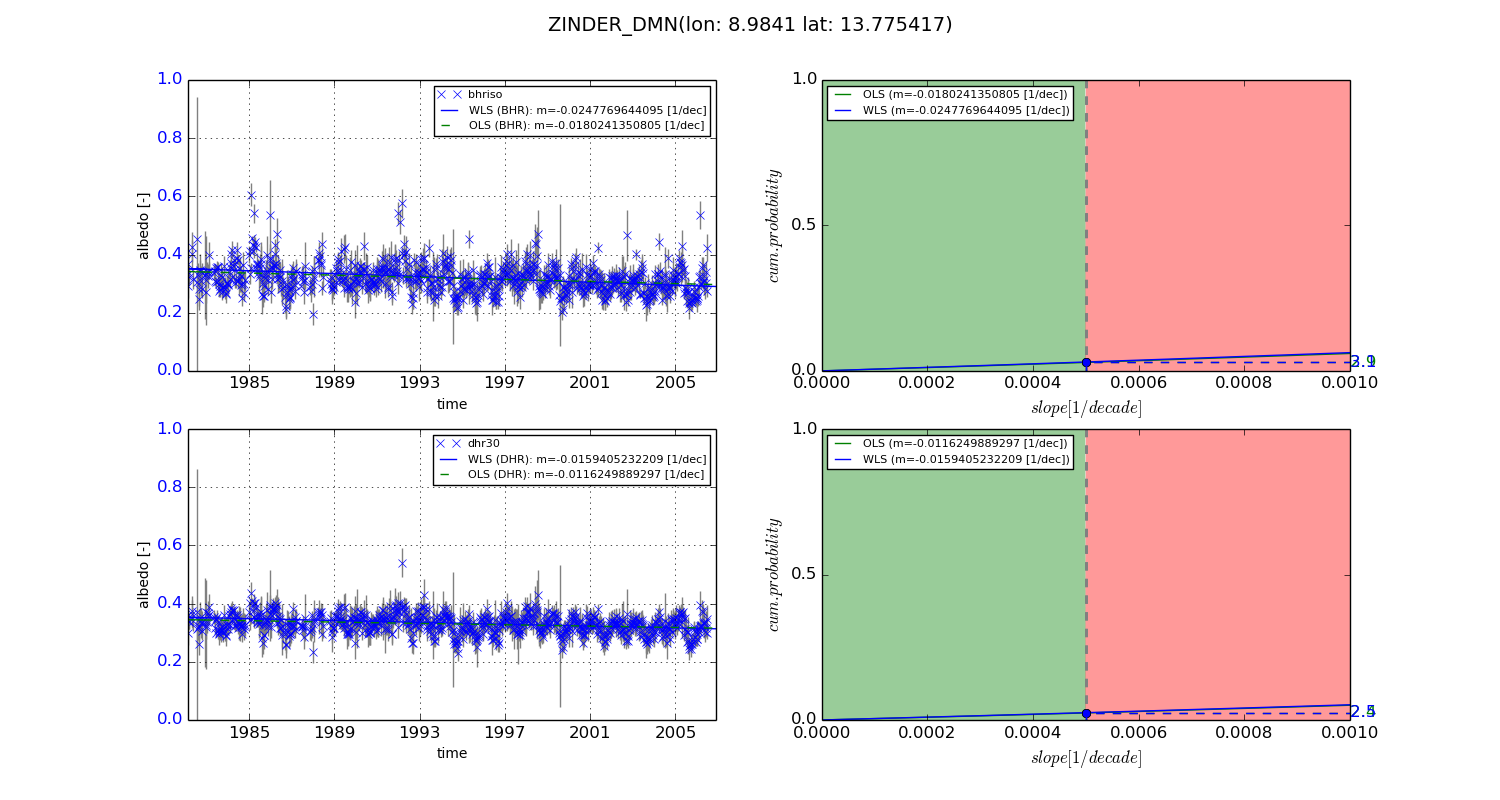
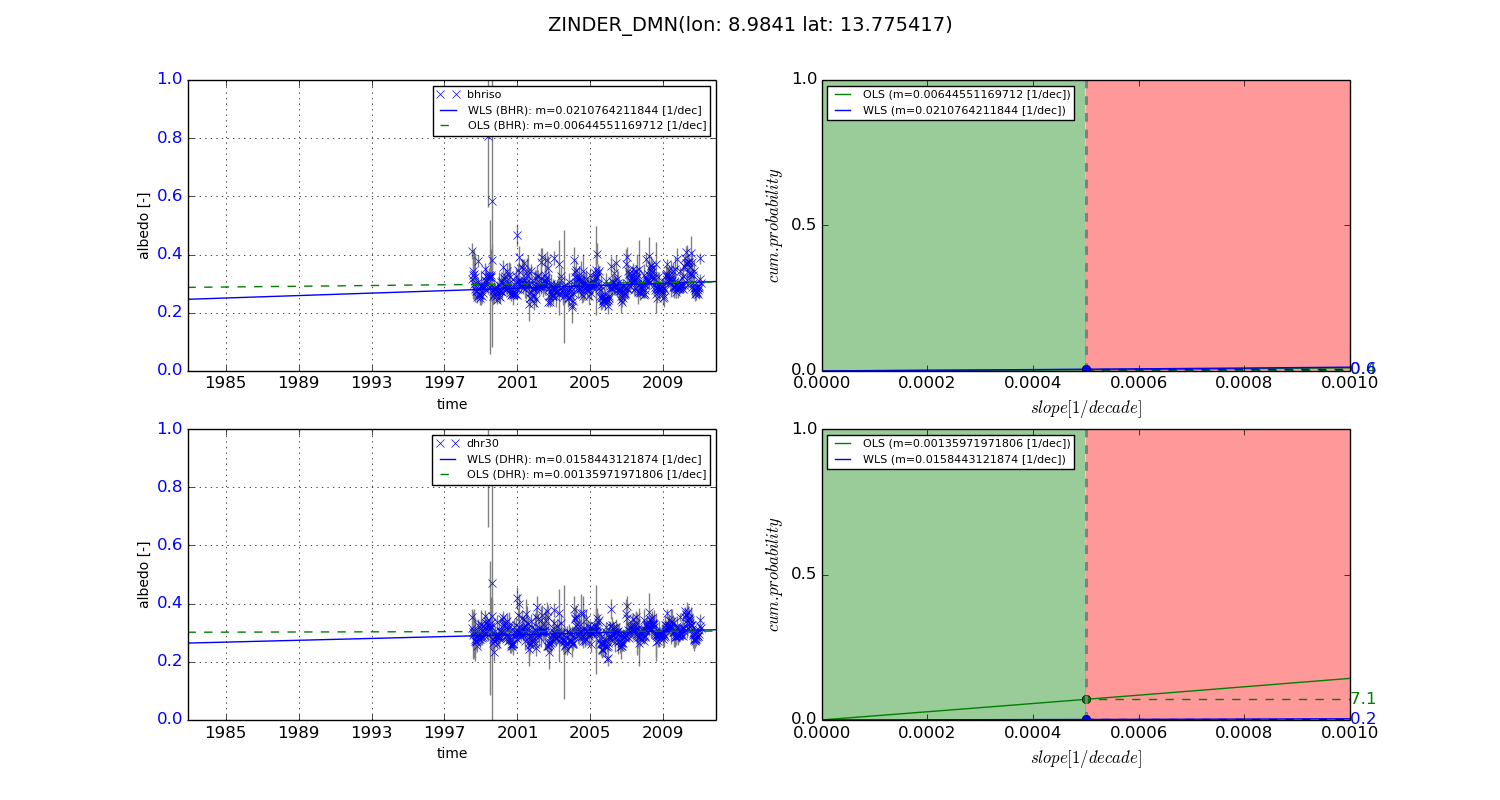
Temporal stability analysis

+000 deg (BHR)


BHR statistics

Temporal stability [1/decade]:


abs

rel


Weighted least square:

-0.0247769644095


Ordinary least square:

-0.0180241350805


Probabilities that GCOS criteria is met:

Weighted least square:

3.1 %

Ordinary least square:

2.9 %


DHR statistics

Temporal stability [1/decade]:


abs

rel


Weighted least square:

-0.0159405232209


Ordinary least square:

-0.0116249889297


Probabilities that GCOS criteria is met:

Weighted least square:

2.5 %

Ordinary least square:

2.4 %


+057/+063 deg (BHR)


BHR statistics

Temporal stability [1/decade]:


abs

rel


Weighted least square:

0.0210764211844


Ordinary least square:

0.00644551169712


Probabilities that GCOS criteria is met:

Weighted least square:

0.6 %

Ordinary least square:

0.4 %


DHR statistics

Temporal stability [1/decade]:


abs

rel


Weighted least square:

0.0158443121874


Ordinary least square:

0.00135971971806


Probabilities that GCOS criteria is met:

Weighted least square:

0.2 %

Ordinary least square:

7.1 %


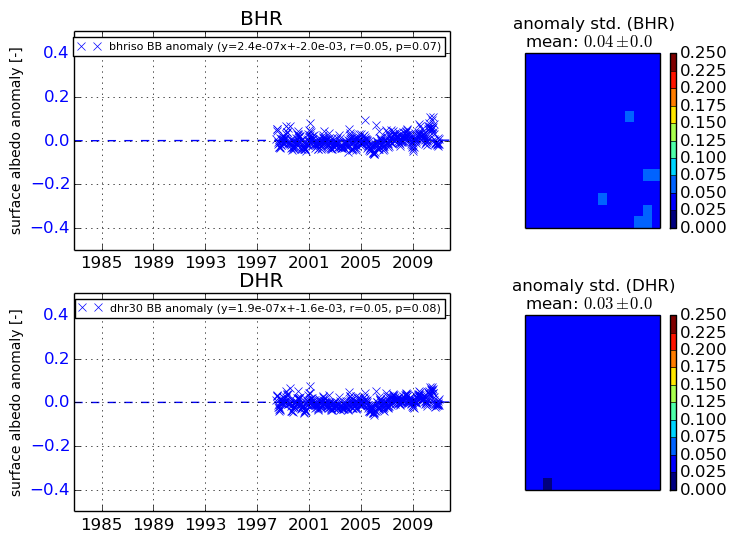
Temporal anomaly analyis

The variance of the temporal anomalies provides an additional measure about the stability of the signal AFTER removal of the mean seasonal cylce.
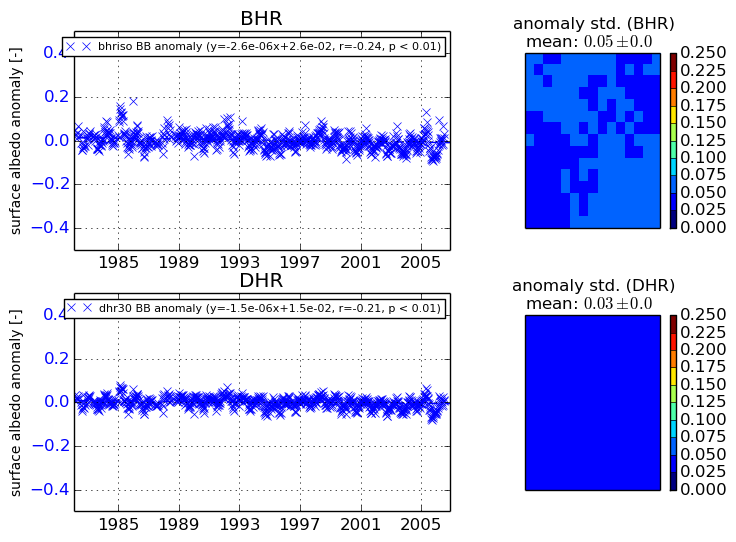
+000 deg


+057/+063 deg