ZOUERATE-FENNEC


Location

lon / lat [deg]: -12.4833 / 22.75

Source network: AERONET


Geostationary surface albedo (GSA) data


“+000”


“+057/+063”


Landcover information (based on ESA CCI landcover data)


Landcover fractions @ 2km distance


Landcover fractions @ 20 km distance


Legend


Distance to open water bodies [km]:

21.95

Distance to urban areas [km]:

22.18


Radius: 1 km

Number of landcover classes:

1

Dominant landcover type:

200: bare areas

Fraction of dominant landcover type [%]:

100.0


Radius: 2 km

Number of landcover classes:

1

Dominant landcover type:

200: bare areas

Fraction of dominant landcover type [%]:

100.0


Radius: 5 km

Number of landcover classes:

1

Dominant landcover type:

200: bare areas

Fraction of dominant landcover type [%]:

100.0


Radius: 10 km

Number of landcover classes:

1

Dominant landcover type:

200: bare areas

Fraction of dominant landcover type [%]:

100.0


Radius: 20 km

Number of landcover classes:

1

Dominant landcover type:

200: bare areas

Fraction of dominant landcover type [%]:

100.0


Disturbances


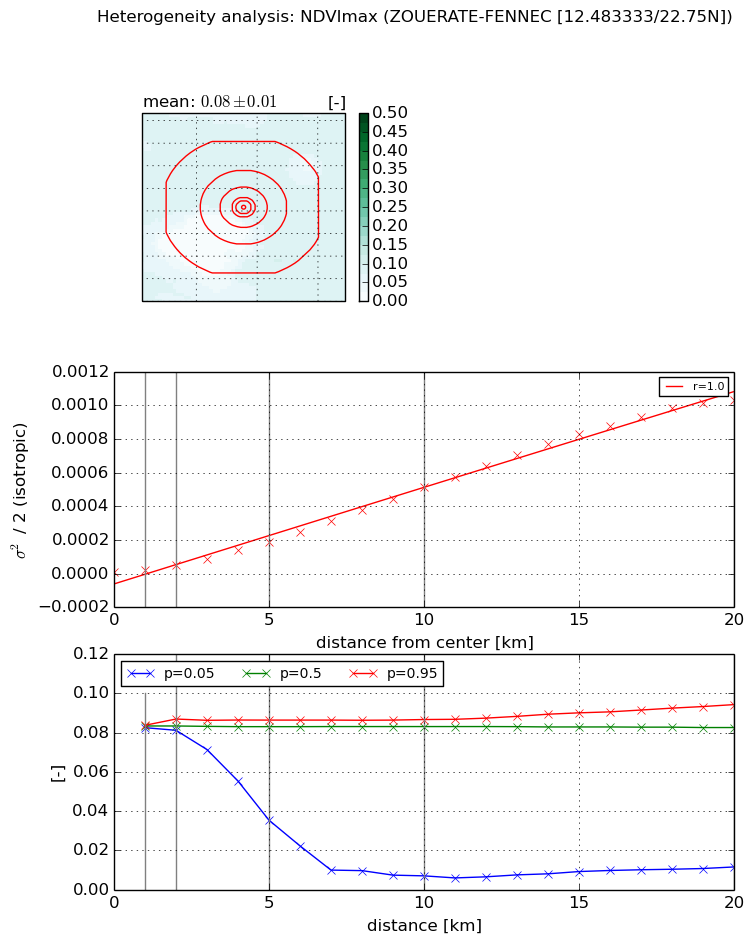
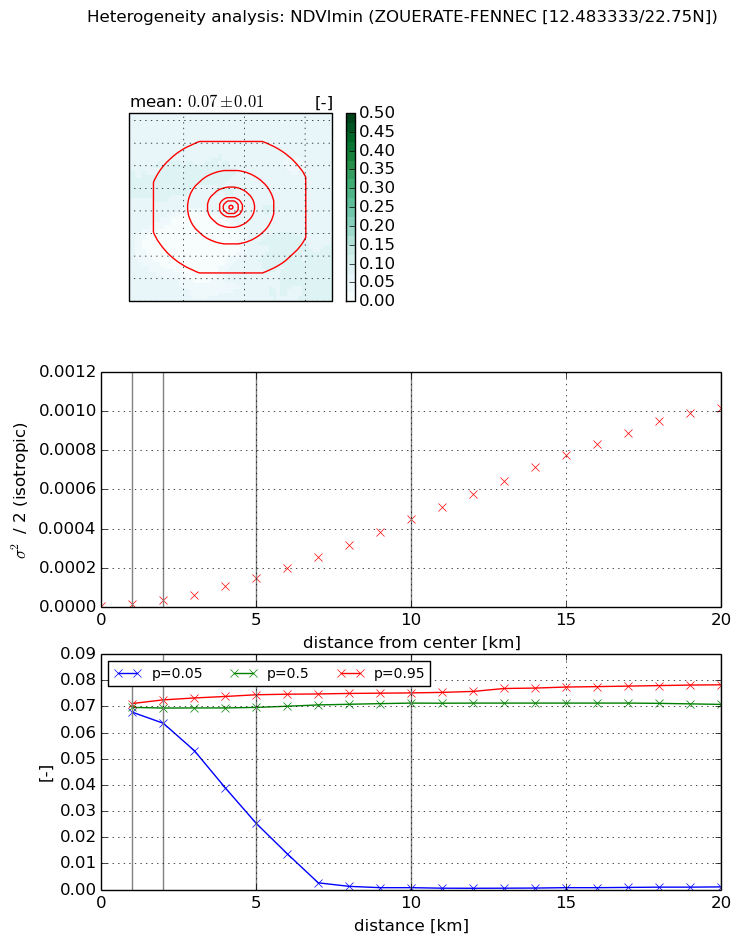
Heterogeneity analysis

The heterogeneity analysis provides information about the spatial and temporal heterogeneity of the site.

Topography


Roman et al. (2009) index


St

3.38525683207e-15

Rcv

0.500707793018

Rse

0.0

Rst

-0.190050664494

Rsv

8.86195685828e+14


Height range @ 1km [m]

9

Height range @ 2km [m]

20

Height range @ 5km [m]

85

Height range @ 10km [m]

-999

Height range @ 20km [m]

-999


Variance slope @ 1 km

545

Variance slope @ 2 km

259

Variance slope @ 5 km

99

Variance slope @ 10 km

-999

Variance slope @ 20 km

-999


NDVI (max. NDVI composite)


Roman et al. (2009) index


St

0.678476272814

Rcv

2.52957557748

Rse

0.0

Rst

-9.63110691429e-10

Rsv

1.89209710225


NDVI range @ 1km [-]

0.0

NDVI range @ 2km [-]

0.01

NDVI range @ 5km [-]

0.05

NDVI range @ 10km [-]

0.08

NDVI range @ 20km [-]

0.08


Variance slope @ 1 km

1.27423863884e-05

Variance slope @ 2 km

2.08696548166e-05

Variance slope @ 5 km

3.58326056625e-05

Variance slope @ 10 km

5.19768050001e-05

Variance slope @ 20 km

5.72610175864e-05


NDVI (min. NDVI composite)I


Roman et al. (2009) index


St

1.17769800034

Rcv

1.54839295879

Rse

0.0

Rst

-2.80890484553e-05

Rsv

-0.998921309141


NDVI range @ 1km [-]

0.0

NDVI range @ 2km [-]

0.01

NDVI range @ 5km [-]

0.05

NDVI range @ 10km [-]

0.07

NDVI range @ 20km [-]

0.08


NDVI slope @ 1 km

8.91298082332e-06

NDVI slope @ 2 km

1.53346111526e-05

NDVI slope @ 5 km

2.86998827983e-05

NDVI slope @ 10 km

4.54273892312e-05

NDVI slope @ 20 km

5.61951510795e-05


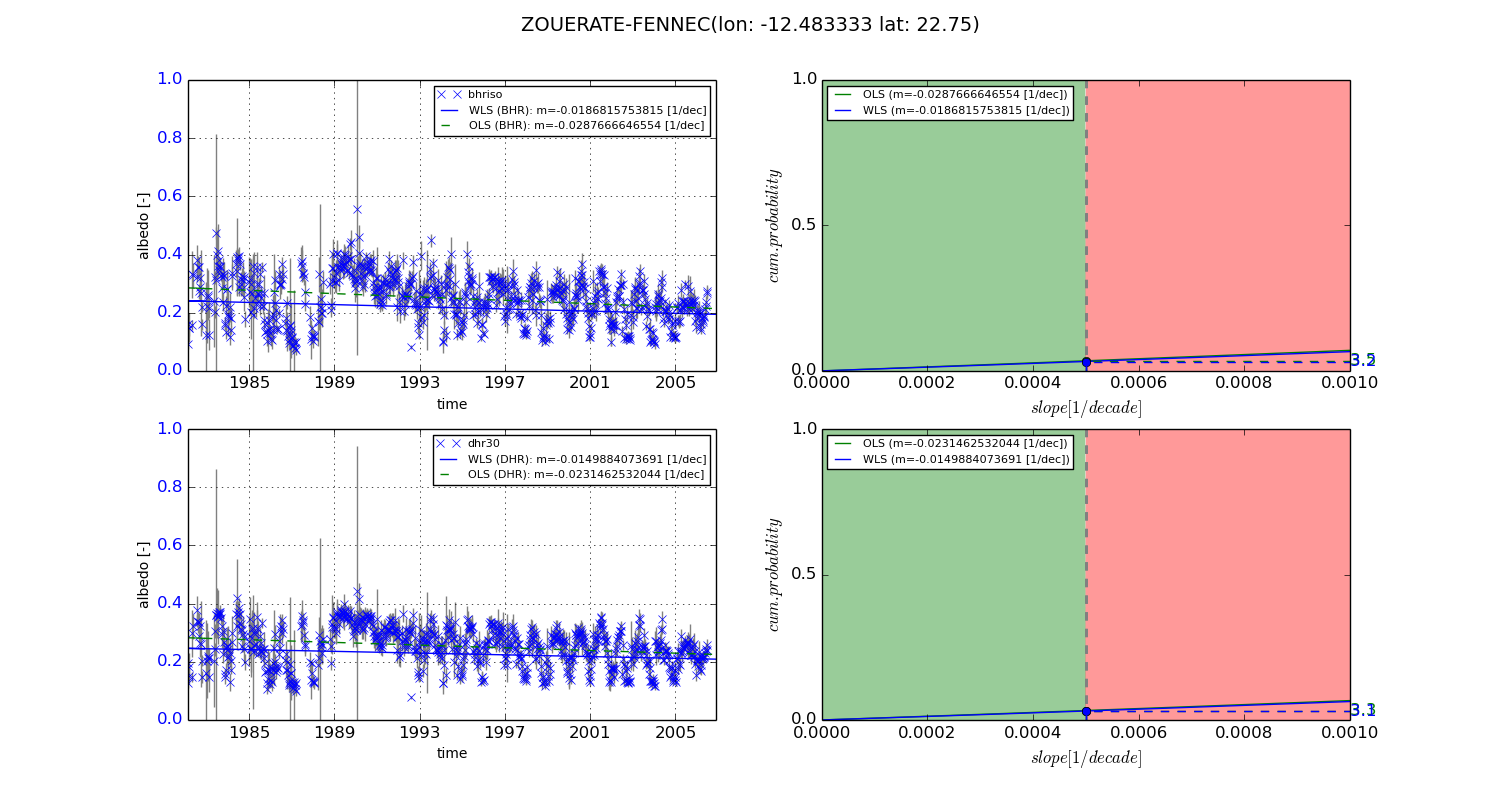
Temporal stability analysis

+000 deg (BHR)


BHR statistics

Temporal stability [1/decade]:


abs

rel


Weighted least square:

-0.0186815753815


Ordinary least square:

-0.0287666646554


Probabilities that GCOS criteria is met:

Weighted least square:

3.2 %

Ordinary least square:

3.5 %


DHR statistics

Temporal stability [1/decade]:


abs

rel


Weighted least square:

-0.0149884073691


Ordinary least square:

-0.0231462532044


Probabilities that GCOS criteria is met:

Weighted least square:

3.1 %

Ordinary least square:

3.3 %


+057/+063 deg (BHR)


BHR statistics

Temporal stability [1/decade]:


abs

rel


Weighted least square:

-99999.0


Ordinary least square:

-99999.0


Probabilities that GCOS criteria is met:

Weighted least square:

-99999.0 %

Ordinary least square:

-99999.0 %


DHR statistics

Temporal stability [1/decade]:


abs

rel


Weighted least square:

-99999.0


Ordinary least square:

-99999.0


Probabilities that GCOS criteria is met:

Weighted least square:

-99999.0 %

Ordinary least square:

-99999.0 %


Temporal anomaly analyis

The variance of the temporal anomalies provides an additional measure about the stability of the signal AFTER removal of the mean seasonal cylce.
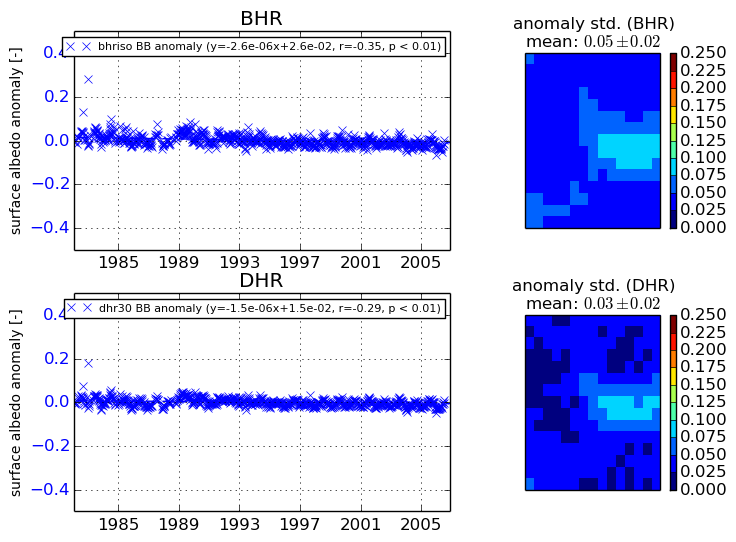
+000 deg


+057/+063 deg